Figure 4.
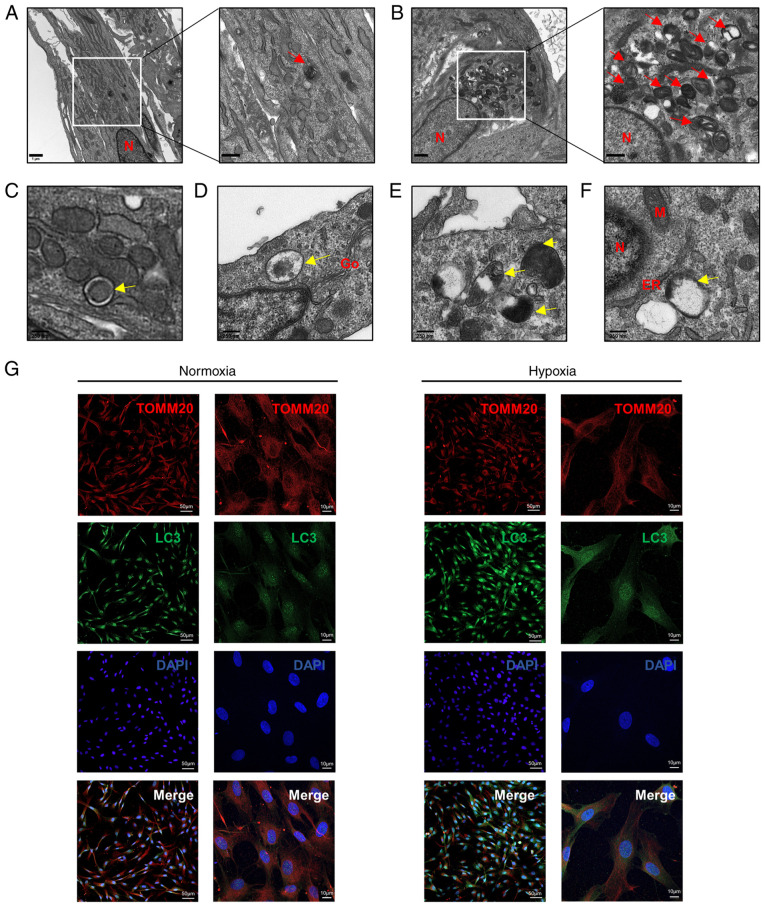
Hypoxia induces mitophagy in HDPCs. (A) Cells in the normoxic group show fewer autolysosomes, which are marked by red arrows. Scale bars are 1 µm and 500 nm, respectively. (B) Cells in the hypoxic group show increased numbers of autolysosomes, which are marked by red arrows. Scale bars are 1 µm and 500 nm respectively. (C-F) The developmental process of autolysosomes. (C) Early stage of autophagosomes marked by yellow arrows in HDPCs from the hypoxic group, showing the envelope structure in the vesicles remaining intact. (D) Mid-stage autophagy, showing that the autophagosomes were fused with lysosomes to form autolysosomes and (E) the encapsulated contents were degraded to form indistinct structure. (F) Late-stage autophagy, showing the complete degradation of organelles in the vacuoles. Scale bar, 250 nm. (G) Immunofluorescence staining with the anti-TOMM20 antibody (red) and anti-LC3 antibody (green) was performed in HDPCs. DAPI (blue) staining indicated cell nuclei. Scale bars are 50 and 10 µm, respectively. TOMM20, translocase of outer mitochondrial membrane 20; LC3, microtubule-associated protein 1 light chain 3; DAPI, 4′,6-diamidino-2-phenylindole; N, nucleus; M, mitochondrion; Go, Golgi; ER, endoplasmic reticulum.

