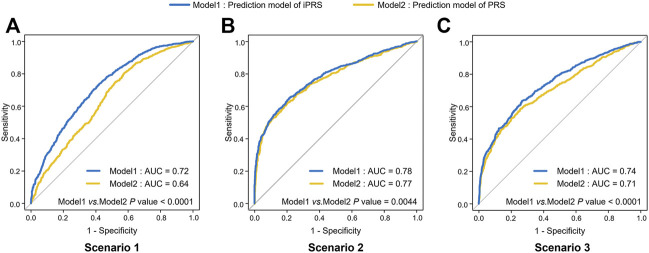
FIGURE 1.
ROC of iPRS prediction model and PRS prediction model in three scenarios of simulations I with independent SNPs. (A) Scenario 1: SNPs are all risk factors, the environmental variant is a risk factor, interactions are antagonistic; (B) Scenario 2: SNPs are all risk factors, the environmental variant is a risk factor, interactions are synergistic; (C) Scenario 3: SNPs are all risk factors, the environmental factor is a risk variant, half of the interactions are antagonistic, and half are synergistic. The p values were shown that the results of comparing the AUC of iPRS prediction model and traditional PRS prediction model.

