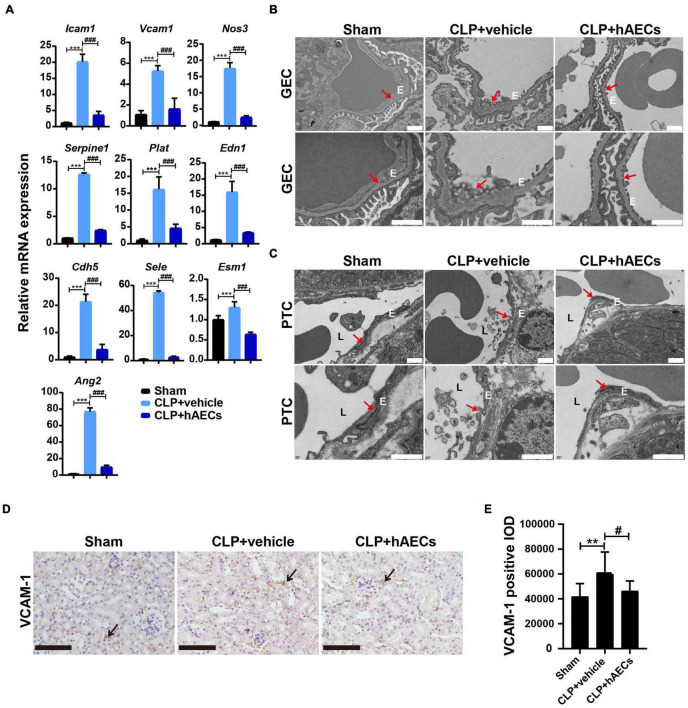
FIGURE 4.
hAECs protected the endothelial cell structure and function from sepsis-associated inflammatory injury. (A) The mRNA levels of indicators associated with endothelial cell adhesion and function of septic mice kidney at 16 h after CLP (n = 3). ***P < 0.001 vs. the sham group; ###P < 0.001 vs. the CLP + vehicle group. (B) Electron microscope images shown glomerular endothelial cell (GEC) fenestrae in the CLP mice at 16 h after CLP. The arrows indicate fenestrae of GECs. Scale bar = 1 μm. E: endothelial cell. (C) Electron microscope images shown tight junction disruption and the damage of the peritubular capillary endothelial layer in the CLP mice at 16 h after CLP. The arrows indicate tight junctions between two adjacent endothelial cells of the peritubular capillary (PTC). Scale bar = 1 μm. E: endothelial cell. L: peritubular capillary lumen. (D) Immunohistochemistry staining of vascular cell adhesion molecule-1 (VCAM-1) in kidney paraffin sections from the indicated groups at 16 h after CLP. Scale bar = 50 μm. Arrows indicate the positive staining. (E) Statistical comparison of integrated optical density (IOD) of VCAM-1 positive staining in the indicated groups. **P < 0.01 vs. the sham group; #P < 0.05 vs. the CLP + vehicle group.

