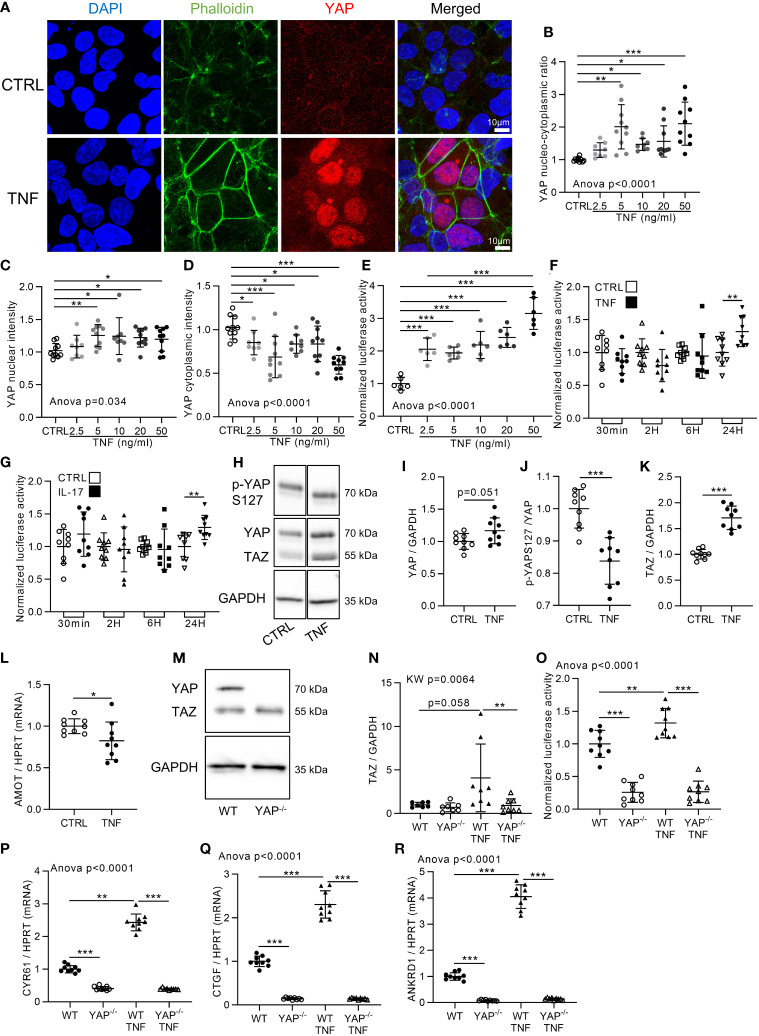
Figure 1.
YAP transcriptional activity is increased by TNF and IL-17. HEK293 were seeded at 100,000 cells/cm2 on fibronectin coated culture plate. Approximately 24 h after seeding cells were treated with TNF at 10 ng/ml for 48 h [or 24 h for (F), (G) and (O)]. (A) Representative airyscan confocal z-stack max intensity images of YAP (immunofluorescence (IF) technique, red), phalloidin (actin, green), DAPI (nucleus, blue), and merged images (luminosity and contrast were enhanced identically for each image for clarity purpose). (B–D) Corresponding IF quantification, with the nucleo-cytoplasmic ratio of YAP labeling (B), YAP mean nuclear intensity (C) and YAP mean cytoplasmic intensity (D). (E–G) Luciferase reporter assay of TEAD transcription factor activity upon different TNF concentrations at 24 h of treatment (E) or at different timings with 10 ng/ml of TNF (F) or 50 ng/ml of IL-17 (G) as indicated. (H–K) Representative western blot of YAP phosphorylation on serin 127 (YAPS127), YAP/TAZ and GAPDH for control or TNF treated cells (H) with their respective quantifications as indicated (I–K). (L) RT-qPCR result for AMOT, results were normalized to HPRT expression. (M, N) Representative western blot of YAP/TAZ and GAPDH for WT and YAP−/− cells (M) with respective TAZ quantification (N). (O) Luciferase reporter assay of TEAD transcription factor activity in WT and YAP−/− control or TNF treated cells. (P–R) RT-qPCR results for CYR61 (P), CTGF (Q), and ANKRD1 (R), results were normalized to HPRT expression. Results are representative of three independent experiments with 2 to 4 biological replicates for each experiment (n = 6 to 10 per group) with T-test or one-way ANOVA test and FDR corrected for multiple comparisons post hoc tests performed between conditions: *p < 0.05; **p < 0.01; ***p < 0.001. Data are expressed as fold change vs. control and presented as individual values with mean ± SD.

