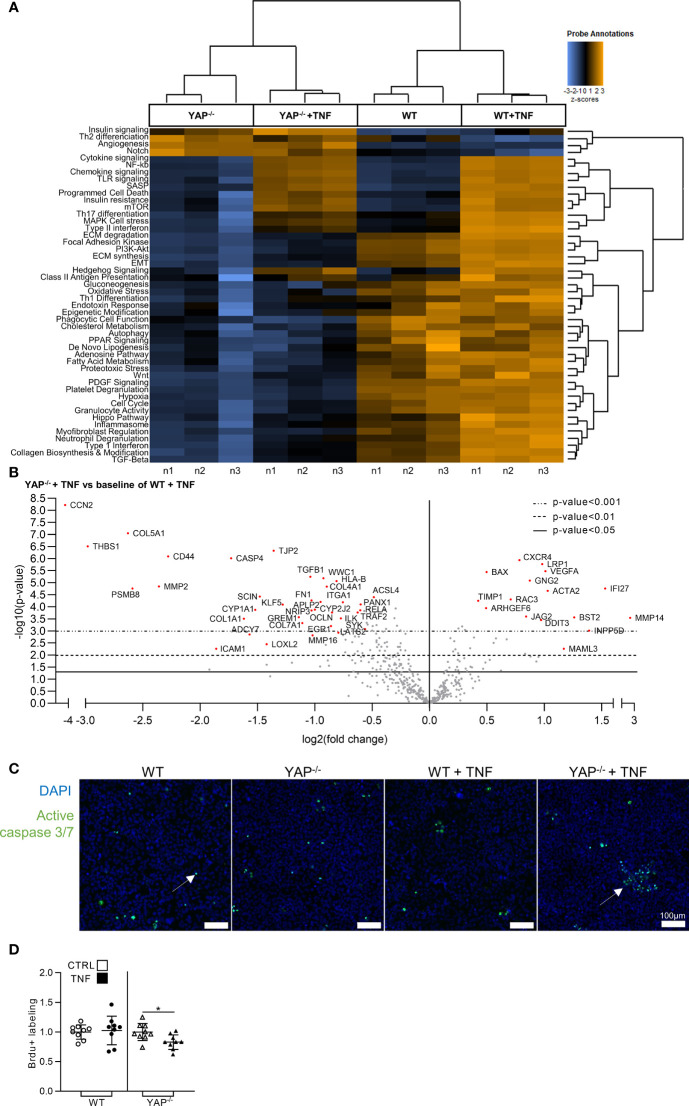
Figure 3.
YAP modulates the expression of fibro-inflammatory pathways and promotes cell survival under TNF administration. HEK293 cells were cultured and treated with TNF as described in Figure 1 . (A) Heat map of nanostring fibrosis panel pathways; pathways are listed to the left, the most upregulated pathways are depicted in orange, and the most downregulated pathways in blue; each column corresponded to one sample (n = 3/group). (B) Volcano plot representation for differential genes expression in YAP−/− + TNF group versus the baseline of WT + TNF group; depicted genes were the most differentially expressed with the combination of a low p-value and a high fold change. (C) Representative live confocal images of active caspase 3/7 labeling (green) and DAPI (nucleus, blue). (D) BrdU assay results; results are representative of three independent experiments with 3 biological replicates for each experiment (n = 9 per group) and are represented as single values with mean ± SD and expressed as fold change vs WT control cells or YAP−/− control cells; comparisons were only performed between CTRL and TNF treated cells, t-test *p < 0.05. For caspase labeling, images are representative of 3 independent experiments.

