Figure 4.
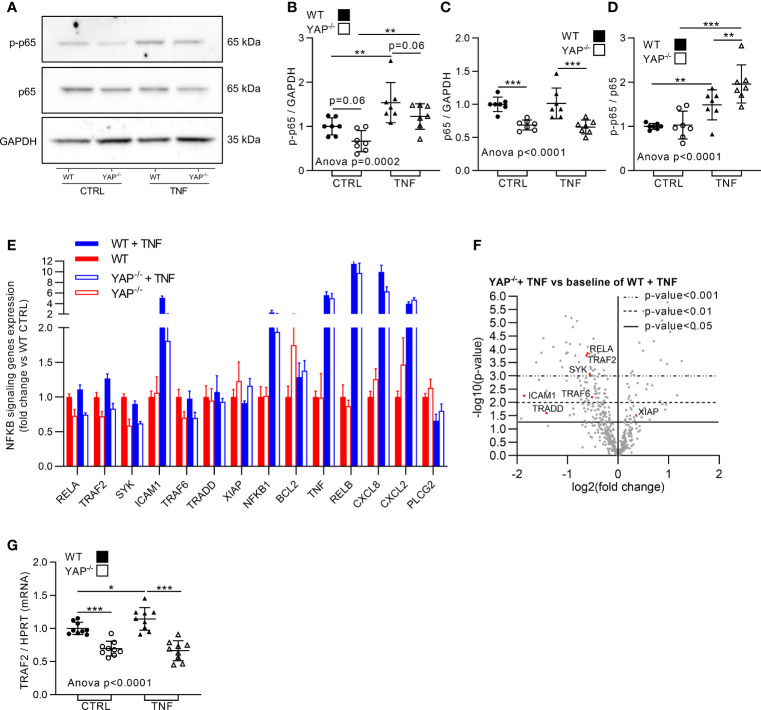
YAP modulates TNF effect on NF-κB pathway. HEK293 cells were cultured and treated with TNF as described in Figure 1 . (A–D) Representative western blot of NF-κB p65 phosphorylation on serin 536 (active form, p-NF-κB), NF-κB p65 and GAPDH for WT and YAP−/− control or TNF treated cells (A) with their respective quantifications as indicated (B–D). (E) Nanostring fibrosis panel histogram for NF-κB pathway in the four groups; depicted genes were selected if at least one comparison between 2 groups gives a p-value <0.05 and must be related to NF-κB signaling. (F) Volcano plot representation for differential genes expression in YAP−/− + TNF group versus the baseline of WT + TNF group; depicted genes are significantly differentially expressed and related to NF-κB pathway. (G) RT-qPCR quantification of TRAF2 expression normalized to HPRT expression. For WB and RT-qPCR, results are representative of three independent experiments with 2 to 3 biological replicates for each experiment (n = 7 to 9 per group) with T-test or one-way ANOVA test and FDR corrected for multiple comparisons post hoc tests performed between conditions: *p < 0.05; **p < 0.01; ***p < 0.001. Data are expressed as fold change vs. control and presented as individual values with mean ± SD (B–D, G) or presented as histogram with mean + SD (E).

