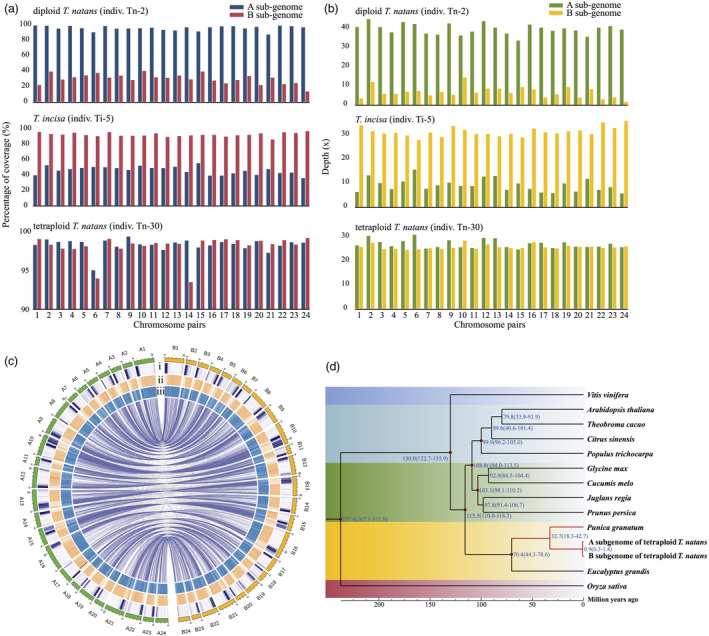
Figure 2.

(a, b) The genome mapping coverage (a) and depth (b) of resequenced individuals (one representative each for diploid T. natans, T. incisa and tetraploid T. natans) on each chromosome pair of tetraploid T. natans reference genome (see details in Table S10). (c) Circos plot of the multidimensional topography of the 24 chromosome pairs of the tetraploid Trapa natans (4x, AABB) reference genome. Concentric circles, from outermost to innermost, show (i) gene density, (ii) repeat element density and (iii) GC content. The three metrics are calculated in 0.1 Mb sliding windows. Homoeologous gene blocks between chromosomes are connected with lines. Chromosome IDs have been re‐assigned to represent the two sets of homoeologous chromosomes (A vs. B). (d) Dated phylogeny for the two subgenomes and 12 other angiosperm species based on 337 orthologous genes. Blue numbers at each node represent the inferred divergence times (in million years ago). Red dots represent calibration times of divergence between Oryza sativa and Vitis vinifera, V. vinifera and Populus trichocarpa, Eucalyptus grandis and Prunus persica, Arabidopsis thaliana and P. persica, Theobroma cacao and P. trichocarpa and Glycine max and Cucumis melo. Calibration times were obtained from the Timetree database (http://www.timetree.org/).
