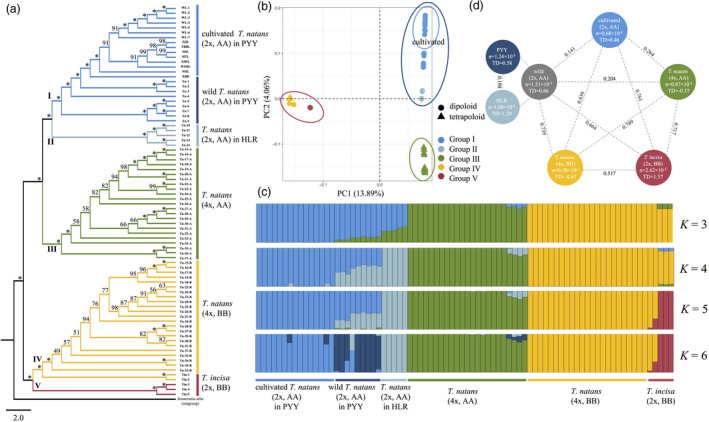
Figure 3.

(a) Phylogenetic (NJ) tree, (b) principal component analysis (PCA) and (c) analyses of genetic structure/admixture (for K = 3–6), based on 339 956 single‐nucleotide polymorphisms (SNPs) obtained from the 57 resequenced genomes of diploid Trapa natans (2x, AA; n = 29, including 14 wild and 15 cultivated individuals), tetraploid T. natans (4x, AABB; n = 23) and diploid T. incisa (2x, BB; n = 5). Note that the A and B subgenomes of tetraploid T. natans individuals were treated separately (4x, AA vs. BB). (d) Corresponding estimates of nucleotide diversity (π) and Tajima’s D (TD; see circles) and F ST summary statistics (see values above stippled lines) for each group. PYY, Pearl–Yangtze–Yellow River region; HLR, Heilongjiang River region.
