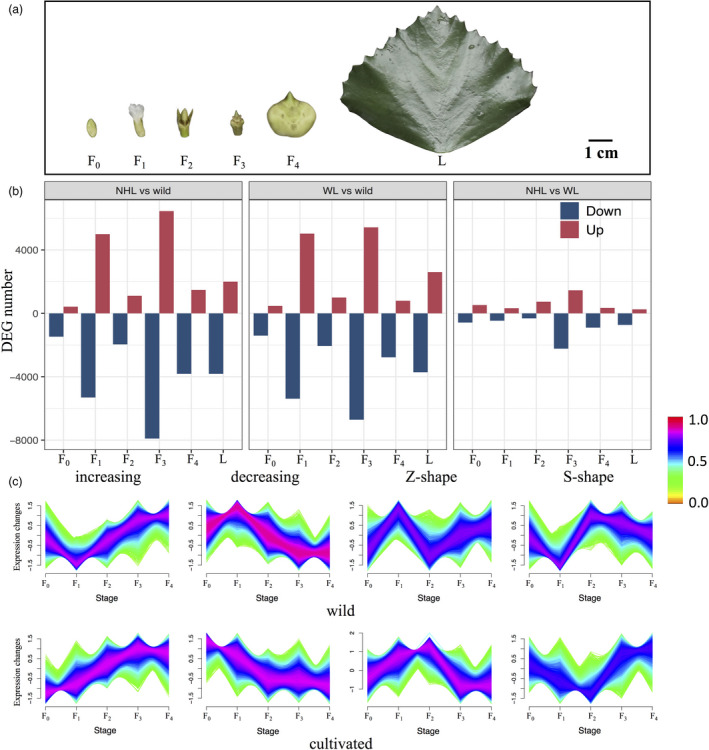
Figure 6.

(a) Five samples of flower/fruit tissues representing five developmental stages (F0: flower bud; F1: fertilized flower; F2: fruit before sepal abscission; F3: fruit after sepal abscission and F4: juvenile fruit) and one sample of leaf tissue (L) used for RNA sequencing (exemplified by the ‘Nanhuling’ (NHL) cultivar; see details in Table S16). (b) Numbers of differentially expressed (up‐ or down‐regulated) genes (DEGs) in three pairwise comparisons between cultivars (NHL, ‘Nanhuling’; WL, ‘Wuling’) and wild accessions of diploid Trapa natans (left: NHL vs. wild; middle: WL vs. wild; right: NHL vs. WL) in six tissue samples viz. developmental stages (flower/fruit stages: F0–F4; leaf: L; see text for details). (c) Changes in gene expression in terms of four reaction norms (‘increasing’, ‘decreasing’, ‘Z‐shape’ and ‘S‐shape’) for wild and cultivated (NHL + WL) accessions, respectively, at the five flower/fruit developmental stages (F0–F4). The colour bar represents the scale of membership scores of a given gene in the corresponding cluster (see Materials and Methods for details regarding the calculations). Genes whose expression patterns are very similar to a given centroid will be assigned a high membership in that cluster (maximum 1.0, red), whereas genes that bear little similarity to the centroid will have a low membership.
