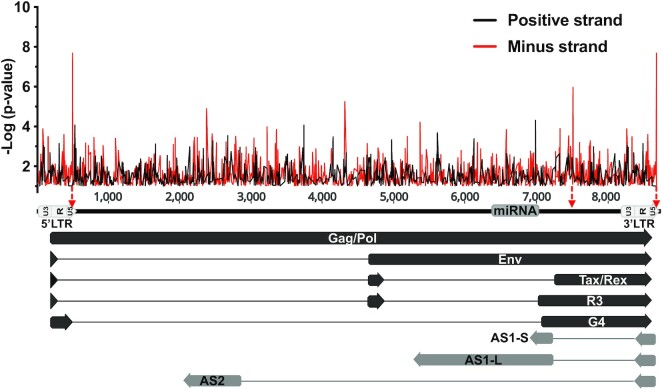
Figure 1.
In silico analysis of putative CTCF binding sites along the BLV provirus. CTCF motifs located either on the positive or on the negative strand are represented by black or red lines, respectively. The three BLV regions showing the highest similarity to the CTCF consensus motif (lowest p-value) are indicated by red arrows. The 5′ and 3′LTR are subdivided into three regions (U3, R, U5). Black arrows represent sense transcripts initiated from the 5′LTR. Grey arrows represent antisense transcripts initiated from the 3′LTR.

