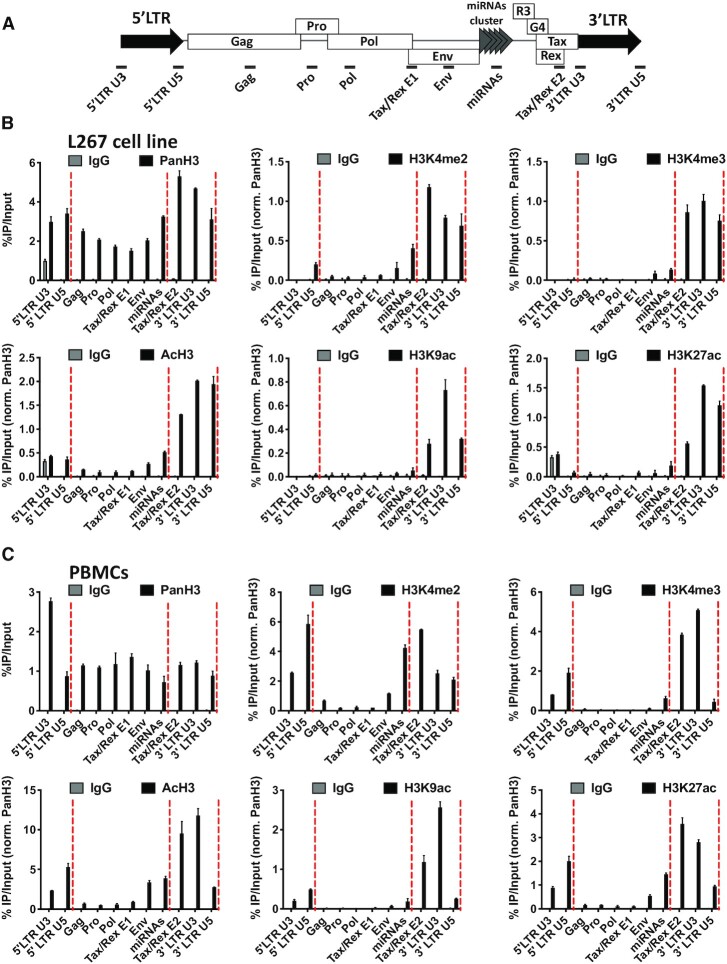
Figure 4.
CTCF localizes to histone marks transitions along the BLV proviral genome. (A) Schematic representation of the BLV proviral genome with the localization of the ChIP-qPCR primers used. Chromatin prepared from BLV infected (B) L267 cells or (C) ovine PBMCs was immunoprecipitated with specific antibodies directed against histone H3 (PanH3), different histone post-translational modifications (H3Kme2, H3Kme3, AcH3, H3K9ac, H3K27ac) or with an IgG as background measurement. Results are presented as histograms indicating percentages of immunoprecipitated DNA compared to the input DNA (%IP/input) normalized to PanH3. Red dashed lines represent CTCF binding sites. Data are the means ± SD from one representative of at least three independent experiments.

