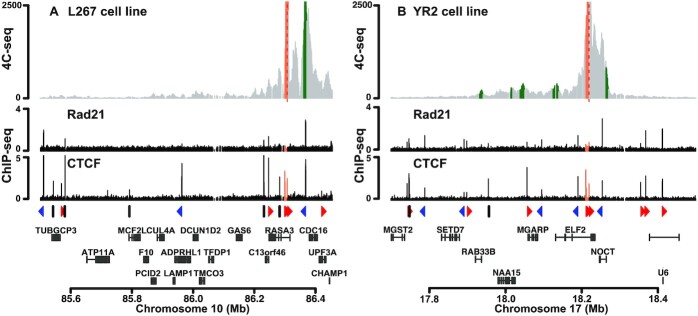
Figure 6.
Chromatin contacts are established between BLV and cellular genomic regions. 4C-seq contact profiles averaged over three biological replicates in the context of (A) L267 cells or (B) YR2 cells using the BLV CTCF binding site of the 5′LTR as viewpoint. ChIP-seq or 4C-seq reads were mapped to a hybrid ovine genome containing the BLV provirus sequence at their respective insertion site and orientation (Supplementary Table S4). Reads mapping to the proviral genome are highlighted in orange. Statistically significant 4C-peaks are highlighted in green. Viewpoint is indicated by a red dashed line. Below the 4C plots, the Rad21 and CTCF ChIP-seq profiles of the extended studied region are shown. The orientation of the CTCF binding motifs is indicated by red (forward) or blue (reverse) triangles or by gray bars (not determined). The names of the surrounding host cellular genes close to the BLV integration site are presented.

