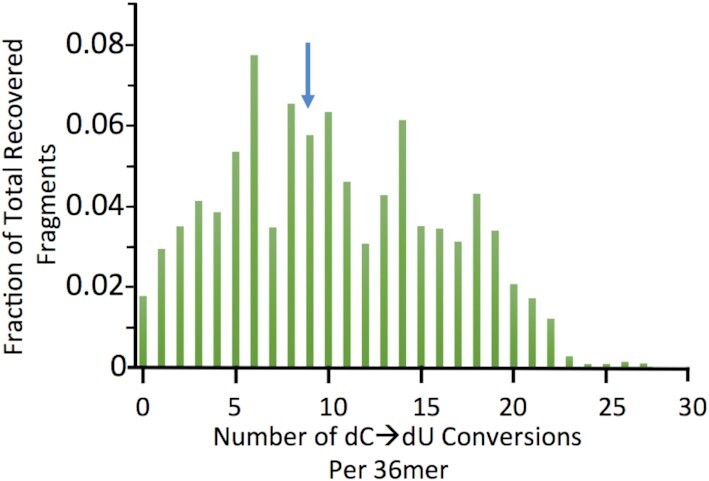
Figure 2.

Frequency distribution for recovered 36mers after bisulfite treatment at 37°C and pH 5.3. Bisulfite treated DNA at 0.5, 1 and 2 μg input oligodeoxynucleotide DNA was recovered after high resolution liquid chromatography. Mass spectrometry showed that it is partially converted with a range of dU/36mer deaminations that are distributed from 0 to 27 dU deaminations in individual 36mers distinguished based on mass. The frequency of each species is plotted versus the number of dUs present in each 36mer as the average for the three input levels. The Distribution is centered on approximately 9dU/36mer (blue arrow). 92% of fragments in the spectrum had masses ≥ that of the d(TCCC)9 36mer.
