
Figure 4.
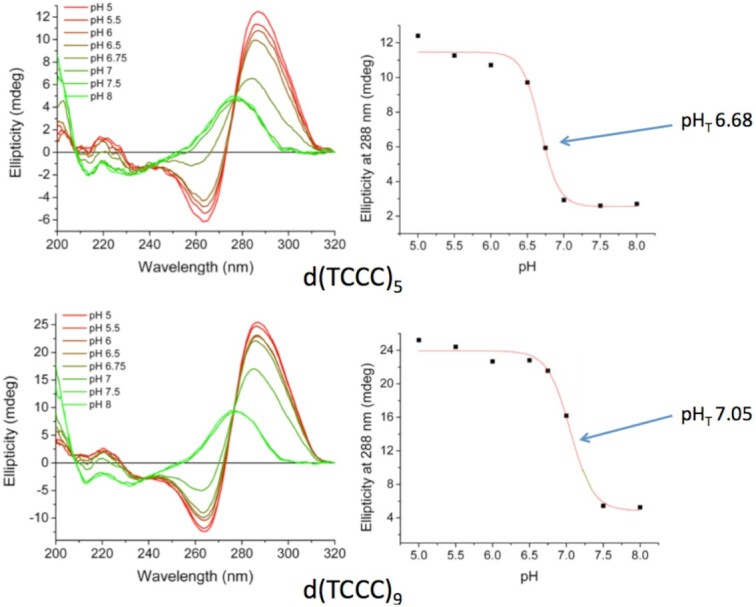
Titration curves for oligodeoxynucleotides with d(TCCC)5 and d(TCCC)9 repeats. CD spectra for each repeat over the titration range pH 5 to pH 8. In each titration, the characteristics i-motif signature emerge as pH is decreased, with the full signature emerging at pH 5 for d(TCCC)5 and at pH 5.5 for d(TCCC)9. Transition pH (pHT) values show that a significant fraction of each sequence would be present as i-motif near physiological pH.