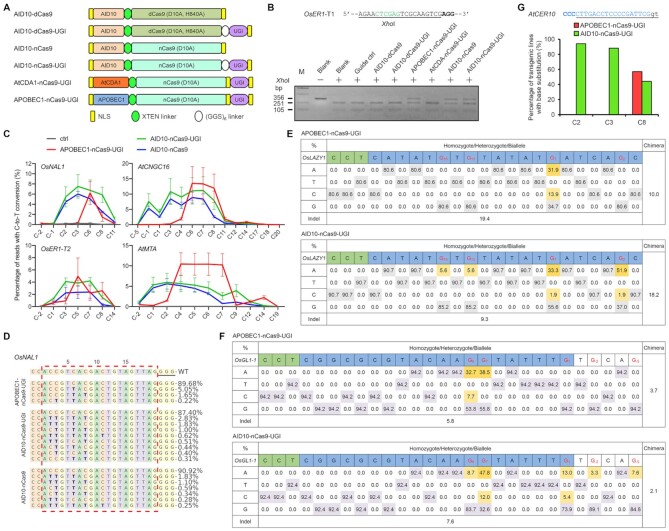
Figure 1.
AID10-nCas9-UGI exhibits a broader activity window than APOBEC1-nCas9-UGI. (A) Schematic diagram of CBEs with an N-terminally fused cytosine deaminase. UGI, uracil glycosylase inhibitor. NLS, nuclear localization signal. (B) Restriction fragment length polymorphism assay identifies active CBEs in rice protoplasts. The target sequence containing an XhoI site (green) is shown with the PAM in bold. bp, base pair. (C) Comparison of cytosine editing efficiencies between APOBEC1-nCas9-UGI, AID10-nCas9-UGI, and AID10-nCas9 at endogenous genomic loci in rice (left) or Arabidopsis (right) protoplasts by amplicon deep sequencing. Data are shown as mean ± s.d. of two biological replicates performed at different times. (D) Mutant allele composition of the OsNAL1 target site in protoplasts expressing APOBEC1-nCas9-UGI, AID10-nCas9-UGI, or AID10-nCas9. C-to-T conversions are highlighted in bold and the frequencies of individual alleles are shown on the right. Dashed-line box marks the protospacer and the PAM is underlined. The numbers on the top indicate the protospacer positions. Data are collected from one replicate in (C). (E, F) Comparison of cytosine editing efficiencies between APOBEC1-nCas9-UGI (top) and AID10-nCas9-UGI (bottom) at OsLAZY1 (E) and OsGL1-1 (F) target sites in transgenic T0 rice plants. Reverse complements of the protospacers and the PAMs are shadowed in blue and green, respectively. All guanines in the protospacers are in red with positions indicated by subscripted numbers. The percentages of indicated alleles among total alleles are shown and those corresponding to base substitutions are shadowed in yellow. (G) Comparison of cytosine editing efficiencies between APOBEC1-nCas9-UGI and AID10-nCas9-UGI at the AtCER10 target site in transgenic T1 Arabidopsis plants. The reverse complement of the protospacer is underlined and the PAM is in bold. The intron splice site is in lowercase letters.

