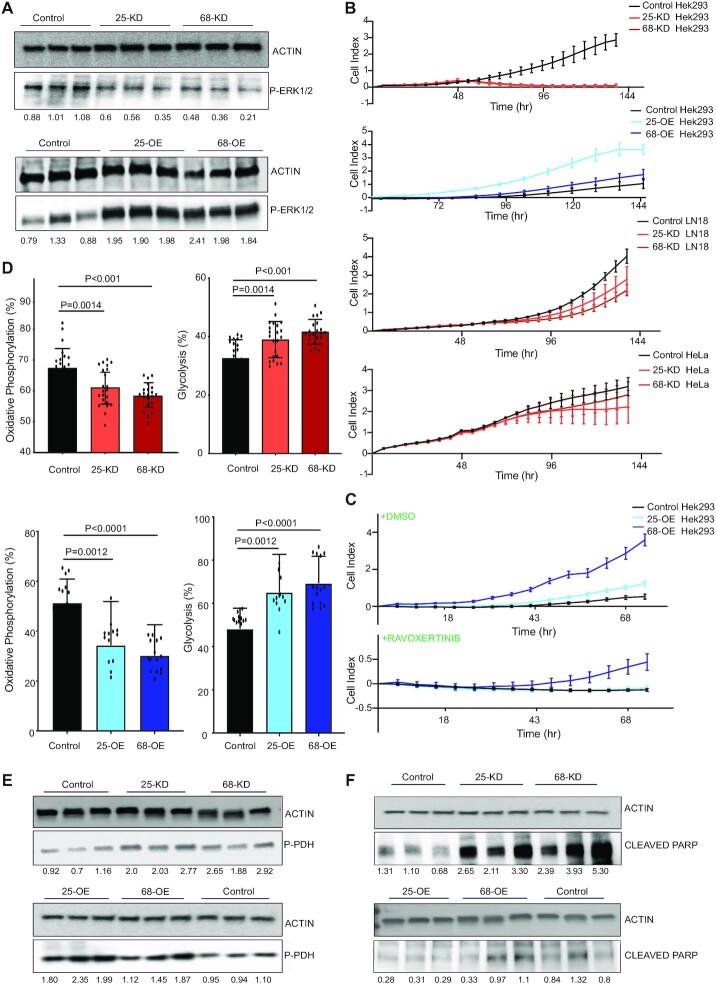
Figure 4.
CFIm expression level is linked to the activity of the ERK signaling pathway. (A) Western blot analysis of phospho-ERK1/2 (P-ERK1/2) levels in cell lysates from the KD and OE cell lines. The numbers below the blots indicate the levels of phospho(P)-ERK1/2 relative to the actin loading control. For the comparison across conditions, the ratio of P-ERK1/2 to actin in all samples was normalized to the average of the values from Control samples. (B) Proliferation index of cells with perturbed CFIm expression and Control cells. Graphs show the observed cell index values in a standard xCelligence real time growth analysis of Control and CFIm25/68 KD and OE HEK293 lines. LN18 and HeLa cells with siRNA-induced depletion of CFIm components were also measured. (C) The proliferation index of CFIm OE lines were compared to that of the Control line in the presence of ERK1/2 inhibitor ravoxertinib hydrochloride added at 6.1 nM final concentration in the growth medium. DMSO-containing medium was used as control, to ascertain the growth defects following the ERK1/2 inhibition. (D) Real time quantification of the rate of adenosine triphosphate (ATP) production via glycolysis and oxidative phosphorylation in live cells. Bar plots show the percentage of ATP produced via the glycolytic and oxidative phosphorylation routes in HEK293 cells in CFIm KD (top) and OE (bottom) relative to Control cells, estimated with the Seahorse ATP assay (see Methods). (E) Western blot estimation of the phosphorylated pyruvate dehydrogenase levels in CFIm25/68 KD/OE and Control HEK293 cells. (F) Estimation of cleaved PARP in lysates obtained from CFIm25/68 KD/OE and Control cells. The quantifications below the blots represent the fold changes of the respective targets in the various conditions in CFIm25/68 KD/OE relative to Control. The relative levels were calculated first by dividing the signal intensity to that of the actin loading control and then further normalized to the mean ratio in Control samples. The fold changes of the respective targets in CFIm25/68 KD/OE relative to Control were statistically significant (P-value in the two tailed t-test ≤ 0.05).

