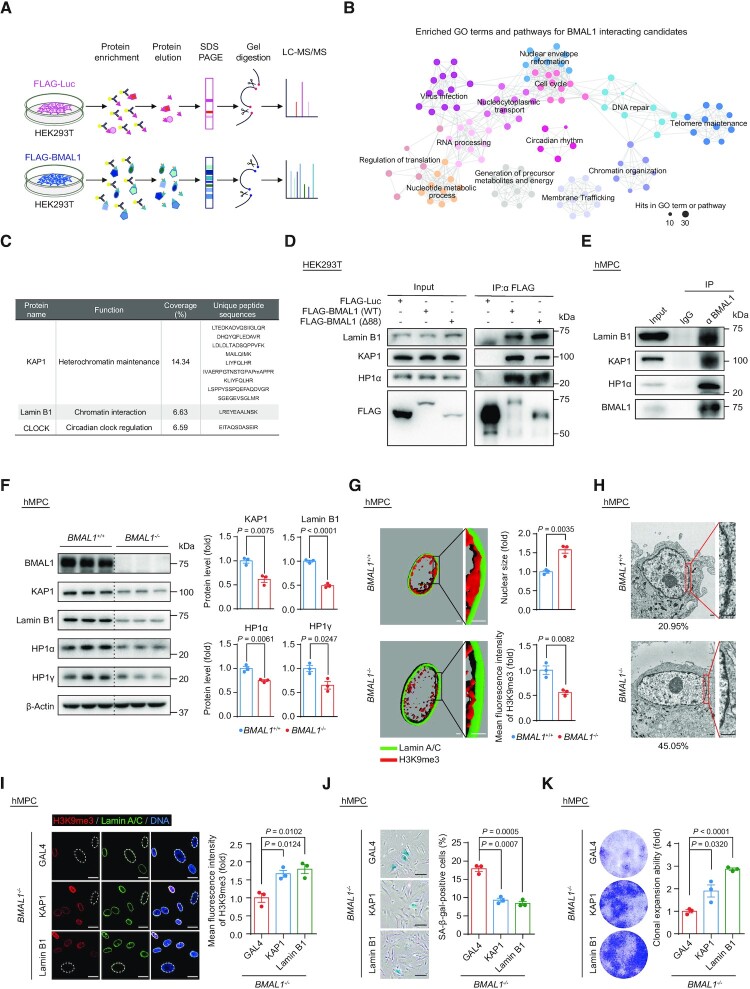
Figure 2.
(A) Schematic diagram of the mass spectrometry strategy for identifying BMAL1 interacting candidates in HEK293T cells. FLAG-Luc was used as a control. (B) GO terms and pathways enrichment analysis of BMAL1 interacting candidates that were identified by mass spectrometry. (C) Detailed information illustrated that KAP1 and Lamin B1 were identified as BMAL1 interacting candidates by mass spectrometry. The BMAL1 interacting candidates identified by mass spectrometry are listed in the Supplementary Table S4. (D) Co-IP analysis of Lamin B1, KAP1 and HP1α with exogenous FLAG-tagged BMAL1 (WT) and FLAG-tagged BMAL1 (Δ88) in HEK293T cells. (E) Co-IP analysis of Lamin B1, KAP1 and HP1α with endogenous BMAL1 in EP (P4) BMAL1+/+ hMPCs. (F) Western blot analysis of the protein levels of heterochromatin associated proteins and nuclear lamina protein Lamin B1 in LP (P9) BMAL1+/+ and BMAL1–/– hMPCs. β-Actin was used as a loading control. Quantitative data on the right are presented as the means ± SEM. n = 3 biological replicates. Two-tailed unpaired Student’s t-test. (G) 3D reconstruction of z-stack immunofluorescence images of H3K9me3 (red) and Lamin A/C (green) in LP (P9) BMAL1+/+ and BMAL1–/– hMPCs. Scale bars: 2 μm. Quantitative data of the mean nuclear size (top) and the mean fluorescence intensity of H3K9me3 (bottom) in LP (P9) BMAL1+/+ and BMAL1–/– hMPCs are presented as the means ± SEM. n = 3 biological replicates with each replicate containing 100 cells. Two-tailed unpaired Student’s t-test. Related to Supplementary Figure S2H. (H) Transmission electron microscopy (TEM) analysis of the peripheral heterochromatin in LP (P9) BMAL1+/+ and BMAL1–/– hMPCs. The percentages of cells with compromised nuclear peripheral heterochromatin are presented at the bottoms of the TEM images. Scale bars: 2 μm. (I) Immunofluorescence staining of H3K9me3 in EP (P4) BMAL1–/– hMPCs transduced with lentiviruses expressing GAL4, KAP1 or Lamin B1 at P2 post transduction. Dashed lines indicate the nuclear boundaries of the cells with decreased H3K9me3 signals. Data are presented as the means ± SEM. n = 3 biological replicates with each replicate containing 100 cells; scale bars: 25 μm. Two-tailed unpaired Student’s t-test. (J) SA-β-gal staining of EP (P4) BMAL1–/– hMPCs transduced with lentiviruses expressing GAL4, KAP1 or Lamin B1 at P2 post transduction. Data are presented as the means ± SEM. n = 3 biological replicates; scale bars: 100 μm. Two-tailed unpaired Student’s t-test. (K) Clonal expansion assay of EP (P4) BMAL1–/– hMPCs transduced with lentiviruses expressing GAL4, KAP1 or Lamin B1 at P2 post transduction. Data are presented as the means ± SEM. n = 3 biological replicates. Two-tailed unpaired Student’s t-test.

