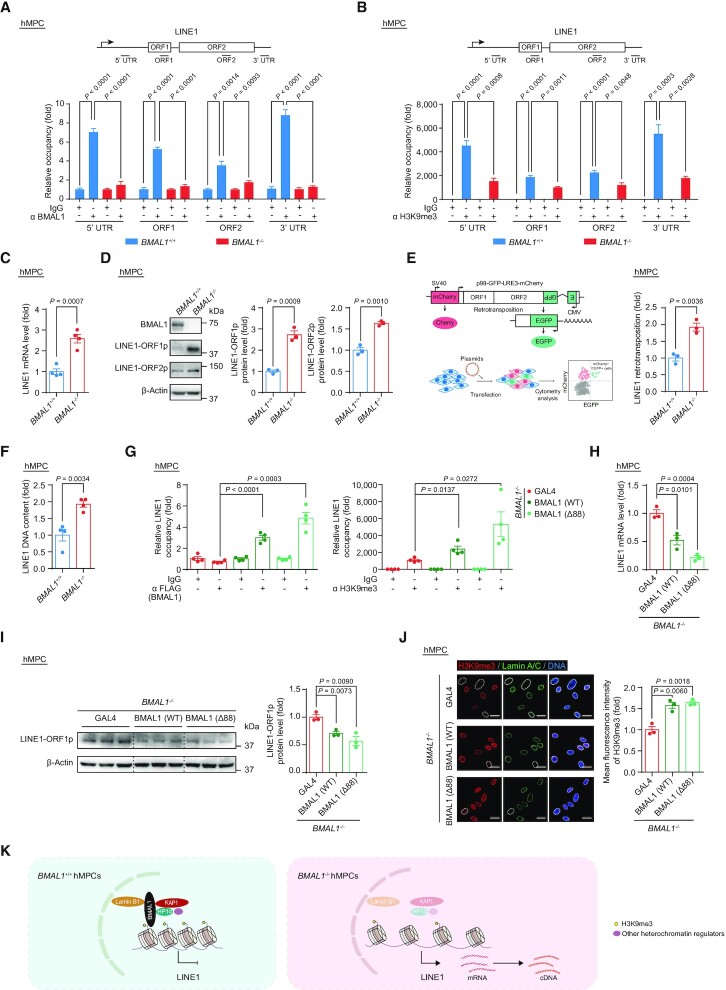
Figure 4.
(A) ChIP-qPCR detection of BMAL1 enrichment at indicated regions of LINE1 in EP (P4) BMAL1+/+ and BMAL1–/– hMPCs. Data are presented as the means ± SEM. n = 4 wells. Data shown are representative of two independent experiments. Two-tailed unpaired Student’s t-test. (B) ChIP-qPCR detection of H3K9me3 enrichment at indicated regions of LINE1 in LP (P9) BMAL1+/+ and BMAL1–/– hMPCs. Data are presented as the means ± SEM. n = 4 wells. Data shown are representative of two independent experiments. Two-tailed unpaired Student’s t-test. (C) RT-qPCR detection of LINE1 mRNA levels in LP (P9) BMAL1+/+ and BMAL1–/– hMPCs. Data are presented as the means ± SEM. n = 4 biological replicates. ACTB was used as the reference gene. Two-tailed unpaired Student’s t-test. (D) Western blot detection of LINE1-ORF1p and LINE1-ORF2p in LP (P9) BMAL1+/+ and BMAL1–/– hMPCs. β-Actin was used as the loading control. Quantitative data are presented as the means ± SEM. n = 3 biological replicates. Two-tailed unpaired Student’s t-test. (E) Quantification of the de novo LINE1 retrotransposition events in LP (P9) BMAL1+/+ and BMAL1–/– hMPCs. Left, schematic diagram of the de novo LINE1 retrotransposition assay. Right, quantification of the de novo LINE1 retrotransposition events in LP (P9) BMAL1+/+ and BMAL1–/– hMPCs are presented as the means ± SEM. n = 3 biological replicates. Two-tailed unpaired Student’s t-test. (F) qPCR detection of LINE1 DNA contents in LP (P9) BMAL1+/+ and BMAL1–/– hMPCs. Data are presented as the means ± SEM. n = 4 biological replicates. 5S rDNA was used as the reference gene. Two-tailed unpaired Student’s t-test. (G) ChIP-qPCR detection of BMAL1 and H3K9me3 at 3’UTR region of LINE1 sequences. Left, ChIP-qPCR detection of enrichment of FLAG-tagged BMAL1 at 3’UTR region of LINE1 sequences in EP (P4) BMAL1–/– hMPCs transduced with lentiviruses expressing GAL4, BMAL1(WT) or BMAL1 (Δ88) at P2 post transduction. Right, ChIP-qPCR detection of H3K9me3 enrichment at 3’UTR region of LINE1 sequences in EP (P4) BMAL1–/– hMPCs transduced with lentiviruses expressing GAL4, BMAL1(WT) or BMAL1 (Δ88) at P2 post transduction. Data are presented as the means ± SEM. n = 4 wells. Data shown are representative of two independent experiments. Two-tailed unpaired Student’s t-test. (H) RT-qPCR detection of LINE1 mRNA levels in EP (P4) BMAL1–/– hMPCs transduced with lentiviruses expressing GAL4, BMAL1 (WT) or BMAL1 (Δ88) at P2 post transduction. Data are presented as the means ± SEM. n = 3 biological replicates. ACTB was used as the reference gene. Two-tailed unpaired Student’s t-test. (I) Western blot detection of LINE1-ORF1p levels in EP (P4) BMAL1–/– hMPCs transduced with lentiviruses expressing GAL4, BMAL1 (WT) or BMAL1 (Δ88) at P2 post transduction. β-Actin was used as the loading control. Data are presented as the means ± SEM. n = 3 biological replicates. Two-tailed unpaired Student’s t-test. (J) Immunofluorescence staining of H3K9me3 and Lamin A/C in EP (P4) BMAL1–/– hMPCs transduced with lentiviruses expressing GAL4, BMAL1 (WT) or BMAL1 (Δ88) at P2 post transduction. Dashed lines indicate the nuclear boundaries of the cells with decreased H3K9me3 signals. Quantification of mean fluorescence intensity of H3K9me3 are presented as the means ± SEM. n = 3 biological replicates with each replicate containing 100 cells; scale bars: 25 μm. Two-tailed unpaired Student’s t-test. (K) Diagram showing that BMAL1, together with KAP1, HP1α, Lamin B1 and other heterochromatin regulators, acts as a complex that binds to LINE1 regions and represses its activation.

