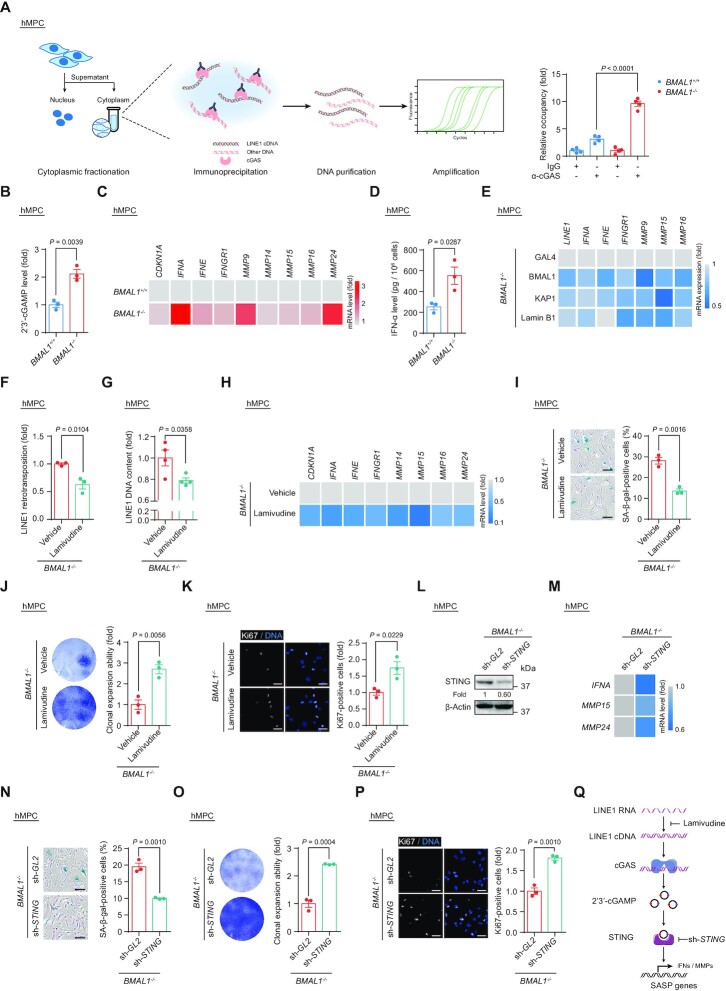
Figure 5.
(A) Co-immunoprecipitation of cGAS with cytoplasmic LINE1 cDNA in LP (P9) BMAL1+/+ and BMAL1–/– hMPCs. Left, schematic diagram of the ChIP-qPCR strategy for measuring the level of cGAS-immunoprecipitated cytoplasmic LINE1 cDNA. Right, quantitative data of the levels of cytoplasmic LINE1 cDNA immunoprecipitated by cGAS in LP (P9) BMAL1+/+ and BMAL1–/– hMPCs. Data are presented as the means ± SEM. n = 4 wells. Data shown are representative of two independent experiments. Two-tailed unpaired Student’s t-test. (B) ELISA detection of 2’3’-cGAMP levels in culture medium of LP (P9) BMAL1+/+ and BMAL1–/– hMPCs. Data are presented as the means ± SEM. n = 3 biological replicates. Two-tailed unpaired Student’s t-test. (C) Heatmap showing the mRNA levels of indicated genes in LP (P9) BMAL1+/+ and BMAL1–/– hMPCs. Data are presented as the mean values of three biological replicates. The color key from gray to red indicates low to high of the relative expression level. ACTB was used as the reference gene. (D) ELISA detection of IFN-α levels in culture medium of LP (P9) BMAL1+/+ and BMAL1–/– hMPCs. Data are presented as the means ± SEM. n = 3 biological replicates. Two-tailed unpaired Student’s t-test. (E) Heatmap showing the mRNA levels of indicated genes in EP (P4) BMAL1–/– hMPCs transduced with lentiviruses expressing GAL4, BMAL1, KAP1 and Lamin B1 at P2 post transduction. Data are presented as the mean values of three biological replicates. The color key from gray to blue indicates high to low of the relative expression level. ACTB was used as the reference gene. (F) Quantification of the de novo LINE1 retrotransposition events in BMAL1–/– hMPCs (P7) treated with vehicle or lamivudine at P2 post transduction. Data are presented as the means ± SEM. n = 3 biological replicates. Two-tailed unpaired Student’s t-test. (G) qPCR detection of LINE1 DNA contents in BMAL1–/– hMPCs (P7) treated with vehicle or lamivudine at P2 post treatment. Data are presented as the means ± SEM. n = 4 wells. Data shown are representative of two independent experiments. 5S rDNA was used as the reference gene. Two-tailed unpaired Student’s t-test. (H) Heatmap showing the mRNA levels of indicated genes in BMAL1–/– hMPCs (P7) treated with vehicle or lamivudine at P2 post treatment. Data are presented as the mean values of four wells. The color key from gray to blue indicates high to low of the relative expression level. ACTB was used as the reference gene. (I) SA-β-gal staining in BMAL1–/– hMPCs (P7) treated with vehicle or lamivudine at P2 post treatment. Data are presented as the means ± SEM. n = 3 biological replicates; scale bars: 100 μm. Two-tailed unpaired Student’s t-test. (J) Clonal expansion assay of BMAL1–/– hMPCs (P7) treated with vehicle or lamivudine at P2 post treatment. Data are presented as the means ± SEM. n = 3 biological replicates; Two-tailed unpaired Student’s t-test. (K) Immunofluorescence staining of Ki67 in BMAL1–/– hMPCs (P7) treated with vehicle or lamivudine at P2 post treatment. Data are presented as the means ± SEM. n = 3 biological replicates with each replicate containing > 100 cells; scale bars: 50 μm. Two-tailed unpaired Student’s t-test. (L) Western blot analysis of STING levels in EP (P4) BMAL1–/– hMPCs transduced with lentiviruses expressing sh-GL2 and sh-STING at P2 post transduction. β-Actin was used as the loading control. (M) Heatmap showing the mRNA levels of indicated genes in EP (P4) BMAL1–/– hMPCs transduced with lentiviruses expressing sh-GL2 and sh-STING at P2 post transduction. Data are presented as the mean values of 3 biological replicates. The color key from gray to blue indicates high to low of the relative expression level. ACTB was used as the reference gene. (N) SA-β-gal staining in EP (P4) BMAL1–/– hMPCs transduced with lentiviruses expressing sh-GL2 and sh-STING at P2 post transduction. Data are presented as the means ± SEM. n = 3 biological replicates; scale bars: 100 μm. Two-tailed unpaired Student’s t-test. (O) Clonal expansion assay of EP (P4) BMAL1–/– hMPCs transduced with lentiviruses expressing sh-GL2 and sh-STING at P2 post transduction. Data are presented as the means ± SEM. n = 3 biological replicates; two-tailed unpaired Student’s t-test. (P) Immunofluorescence staining of Ki67 in EP (P4) BMAL1–/– hMPCs transduced with lentiviruses expressing sh-GL2 and sh-STING at P2 post transduction. Data are presented as the means ± SEM. n = 3 biological replicates with each replicate containing > 100 cells; scale bars: 50 μm. Two-tailed unpaired Student’s t-test. (Q) Schematic diagram showing how LINE1 triggers the activation of cGAS-STING pathway and interferon and SASP response in BMAL1–/– hMPCs. Lamivudine treatment or STING knockdown in BMAL1–/– hMPCs blocks the activation of cGAS-STING pathway and SASP response induced by LINE1.

