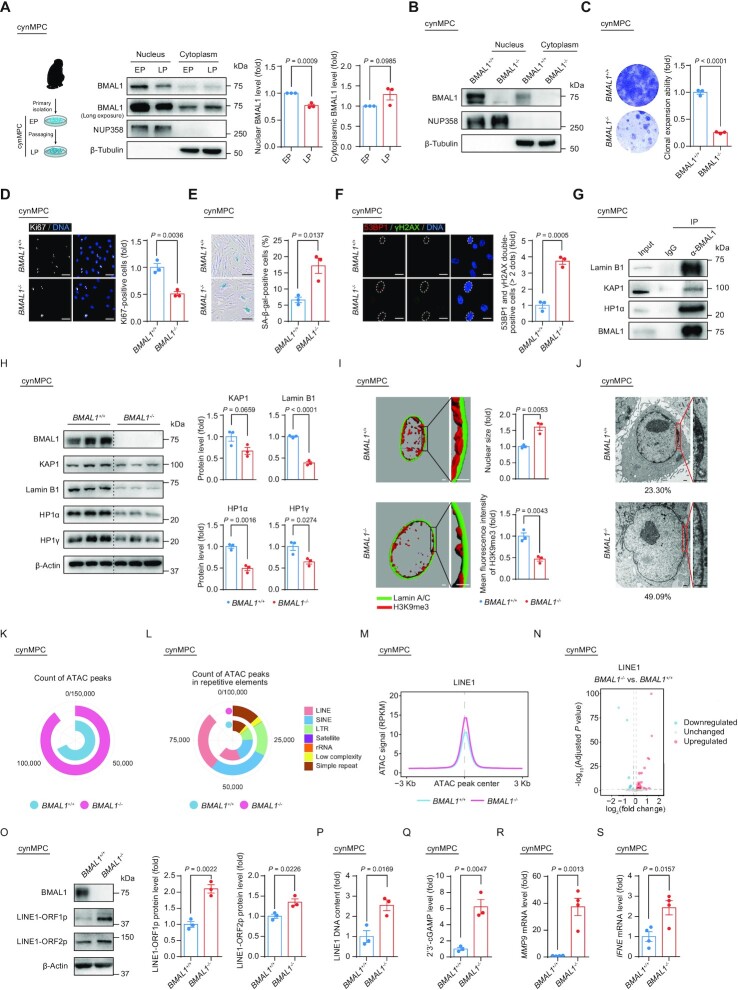
Figure 6.
(A) Schematic diagram illustrating the isolation and culture of EP (P5) and LP (P13) BMAL1+/+ cynMPCs and western blot analysis of BMAL1 in EP (P5) and LP (P13) BMAL1+/+ cynMPCs. β-Tubulin and NUP358 were used as the loading control for the cytoplasmic and nuclear fractions, respectively. Quantitative data are presented as the means ± SEM. n = 3 independent experiments. Two-tailed unpaired Student’s t-test. (B) Western blot analysis of BMAL1 in BMAL1+/+ and BMAL1–/– cynMPCs (P3). β-Tubulin and NUP358 were used as the loading control for the cytoplasmic and nuclear fractions, respectively. (C) Clonal expansion assay of BMAL1+/+ and BMAL1–/– cynMPCs (P5). Data are presented as the means ± SEM. n = 3 independently cultured wells. Two-tailed unpaired Student’s t-test. (D) Immunofluorescence staining of Ki67 in BMAL1+/+ and BMAL1–/– cynMPCs (P5). Data are presented as the means ± SEM. n = 3 replicates from independently cultured wells with each replicate containing > 100 cells; scale bars: 50 μm. Two-tailed unpaired Student’s t-test. (E) SA-β-gal staining in BMAL1+/+ and BMAL1–/– cynMPCs (P5). Data are presented as the means ± SEM. n = 3 independently cultured wells; scale bars: 100 μm. Two-tailed unpaired Student’s t-test. (F) Immunofluorescence staining of 53BP1 and γH2AX in BMAL1+/+ and BMAL1–/– cynMPCs (P5). Dashed lines indicate the nuclear boundaries of the 53BP1 and γH2AX double-positive (> 2 dots) cells. Data are presented as the means ± SEM. n = 3 replicates from independently cultured wells with each replicate containing > 100 cells; scale bars: 25 μm. Two-tailed unpaired Student’s t-test. (G) Co-IP analysis of KAP1, Lamin B1 and HP1α with endogenous BMAL1 protein in BMAL1+/+ cynMPCs (P5). (H) Western blot analysis of the protein levels of heterochromatin associated proteins and nuclear lamina protein Lamin B1 in BMAL1+/+ and BMAL1–/– cynMPCs (P5). β-Actin was used as the loading control. Quantification of protein levels are presented on the right as the means ± SEM. n = 3 independently cultured wells. Two-tailed unpaired Student’s t-test. (I) 3D reconstruction of z-stack immunofluorescence images of H3K9me3 (red) and Lamin A/C (green) in BMAL1+/+ and BMAL1–/– cynMPCs (P5); scale bars: 2 μm. Quantitative data of the mean nuclear size (top) and the mean fluorescence intensity of H3K9me3 (bottom) of BMAL1+/+ and BMAL1–/– cynMPCs are presented as the means ± SEM. n = 3 replicates from independently cultured wells with each replicate containing 100 cells. Two-tailed unpaired Student’s t-test. Related to Supplementary Figure S5E. (J) Transmission Electron microscopy (TEM) analysis of the heterochromatin architecture at the nuclear periphery in BMAL1+/+ and BMAL1–/– cynMPCs (P5). The percentages of cells with compromised nuclear peripheral heterochromatin are presented at the bottom of each TEM image; scale bars: 2 μm. (K) Ring plot showing the count of ATAC peaks in BMAL1+/+ and BMAL1–/– cynMPCs (P5). (L) Ring plot showing the count of ATAC peaks in indicated repetitive elements in BMAL1+/+ and BMAL1–/– cynMPCs (P5). (M) Metaplot showing the ATAC signals (RPKM) ranging from 3 kb upstream to 3 kb downstream of LINE1-localized ATAC peak centers in BMAL1+/+ and BMAL1–/– cynMPCs (P5). (N) Volcano plot showing the differentially expressed LINE1 elements in BMAL1–/– cynMPCs compared to BMAL1+/+ cynMPCs (P5). (O) Western blot detection of LINE1-ORF1p and LINE1-ORF2p in BMAL1+/+ and BMAL1–/– cynMPCs (P5). β-Actin was used as the loading control. Quantitative data are presented as the means ± SEM. n = 3 independently cultured wells. Two-tailed unpaired Student’s t-test. (P) qPCR detection of LINE1 DNA contents in BMAL1+/+ and BMAL1–/– cynMPCs (P5). Data are presented as the means ± SEM. n = 3 independently cultured wells. 5S rDNA was used as the reference gene. Two-tailed unpaired Student’s t-test. (Q) ELISA detection of 2’3’-cGAMP levels in culture medium of BMAL1+/+ and BMAL1–/– cynMPCs (P5). Data are presented as the means ± SEM. n = 3 independently cultured wells. Two-tailed unpaired Student’s t-test. (R) RT-qPCR detection of MMP9 mRNA levels in BMAL1+/+ and BMAL1–/– cynMPCs (P5). Data are presented as the means ± SEM. n = 4 wells. ACTB was used as the reference gene. Data shown are representative of two independent experiments. Two-tailed unpaired Student’s t-test. (S) RT-qPCR detection of IFNE mRNA levels in BMAL1+/+ and BMAL1–/– cynMPCs (P5). Data are presented as the means ± SEM. n = 4 wells. ACTB was used as the reference gene. Data shown are representative of two independent experiments. Two-tailed unpaired Student’s t-test.

