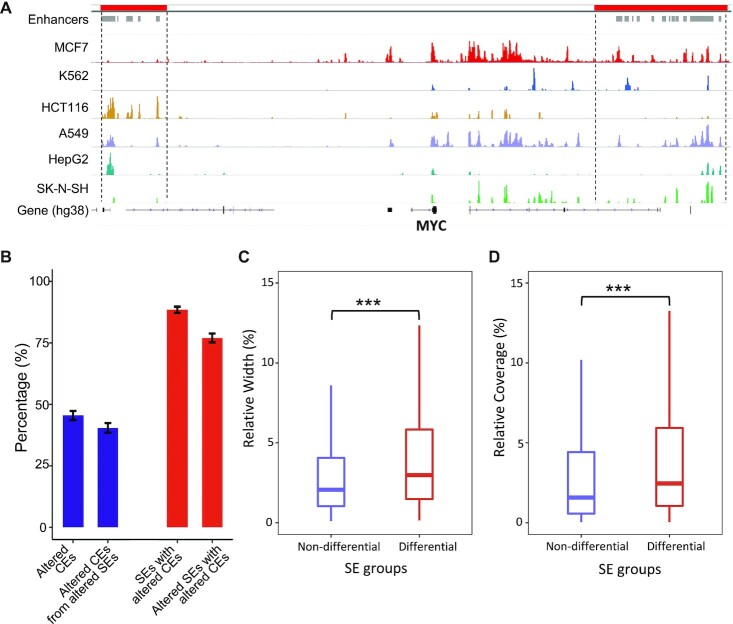
Figure 1.
Internal dynamics of super enhancers. (A) CEs show frequent alterations across cancer cell types at two reported SE loci associated to MYC regulation. ChIP-seq coverage of H3K27Ac are shown. SEs and CEs are labeled at the top as red and grey bars, separately. (B) Frequencies of differential CEs (fold-change > 4 & q-value < 0.05) and SEs (based on binary strategy). (C) Relative width of differential CEs from non-differential and differential SEs (Student's t-test P < 2.2e–16). Relative width is defined as the percentage of CE width over the summed width from all CEs within a SE. (D) Relative coverage of differential CEs from non-differential and differential SEs (Student's t-test P < 2.2e–16). Relative coverage is defined as the percentage of CE coverage over the summed coverage from all CEs within a SE.

