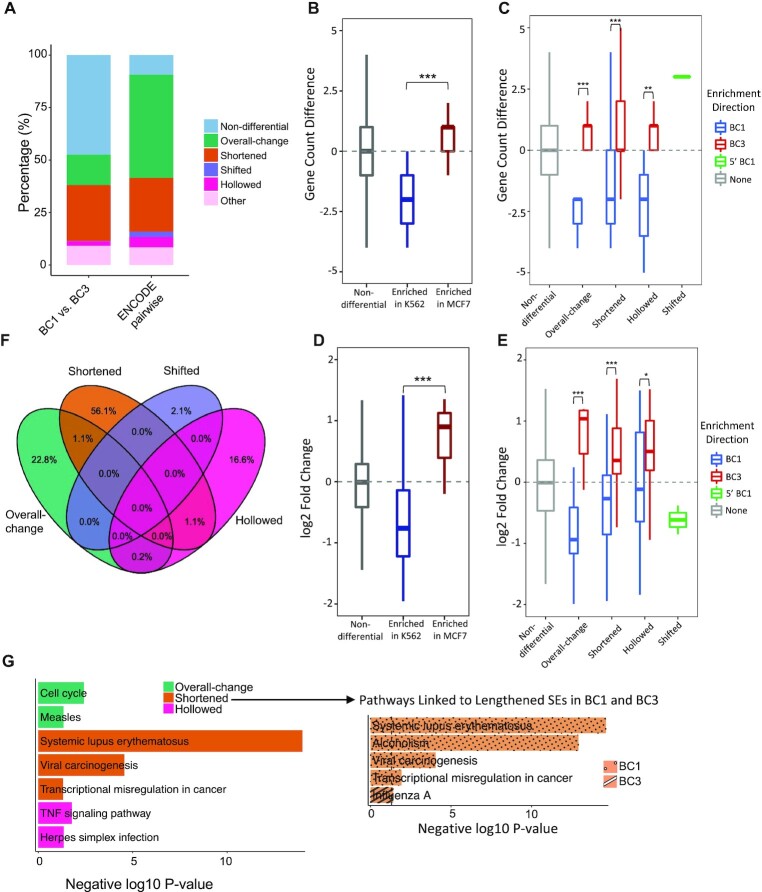
Figure 5.
Identifying SE differences between similar cancer cell lines. (A) Proportions of differential SE categories identified from within-cancer (BC1 versus BC3) and cross-cancer comparisons (pairwise between six cancer cell types from ENCODE). Count differences (B, C) and log2 fold-changes (D, E) of linked genes by differential CEs (B, D) and SEs (C, E) between BC1 and BC3 cell lines. Gene targets are identified based on chromatin contacts from H3K27Ac HiChIP data. P-values were calculated with Wilcoxon rank-sum test (B, C) and Student's t-test (D, E) with notations as *P < 0.05, **P < 0.01, *** P < 0.001 and n.s. = not significant. (F) Overlaps of SE-linked genes across four differential SE categories between BC1 and BC3. (G) KEGG pathways (P < 0.05) that uniquely associated to each differential SE category. Pathways enriched in shortened SEs are highlighted separately for two sub-groups: those lengthened in BC1 and those lengthened in BC3.

