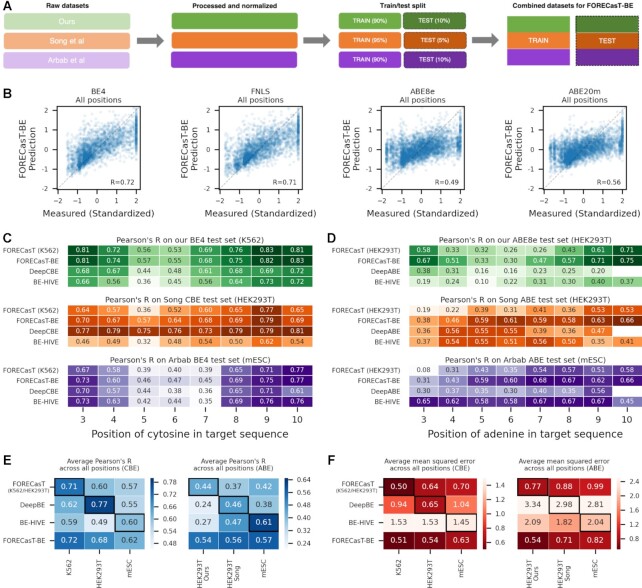
Figure 4.
(A) Schematic of datasets used to train FORECasT-BE. Raw base editing efficiencies from this study (green), Song et al. (orange) and Arbab et al. (purple) are normalized independently to z-scores (opaque boxes), split into training and test sets (light and dark boxes), and combined into final training set and test sets employed by FORECasT-BE. (B) FORECasT-BE accurately predicts editing rate. Measured (x-axis) and predicted (y-axis) standardized editing rate (Methods) for guide RNAs (markers) in each editor we screened (panels). Dashed line: y = x. Label: Pearson's R between measured and predicted scores. (C, D) FORECasT-BE accurately predicts in a variety of contexts. Pearson's R between measurements and predictions of editing rates at different positions in the target (x-axis) for models (y-axis) trained on different cell types (panels) when using cytosine editing (C) or adenine editing (D) datasets. Models: FORECasT trained on only K562 (C) or HEK293T cells (D; top row), FORECasT-BE trained on combined dataset (second row), DeepCBE/DeepABE trained on HEK293T cells (third row) and BE-HIVE trained on mES cells (bottom row). Colors and datasets: as in (A). (E, F) FORECasT-BE generalizes well to many datasets. Average performance of models at all positions (y-axis) as measured using Pearson's R (E, blue heatmaps) and mean squared error (F, red heatmaps) when evaluated on a test set from one cell type (x-axis). Models: as in (C) and (D). Bold outlines: model and dataset from same publication. DeepBE: DeepABE or DeepCBE, depending on the dataset.

