Figure 5.
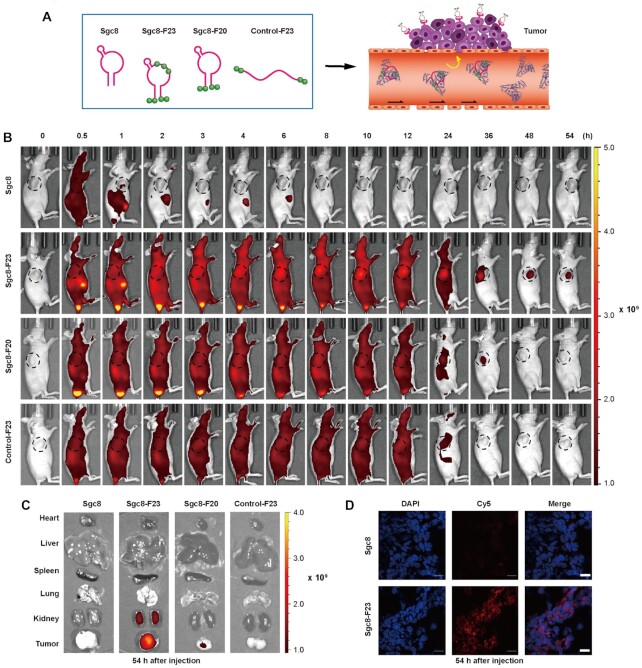
In vivo distribution of optimal modification of Sgc8. (A) Cy5-labeled aptamers were injected into mice to visualize the in vivo binding competition between albumin and tumor cells. (B) In vivo fluorescence imaging of HCT116 tumor-bearing mice after Cy5-labeled sgc8, Sgc8-F23, Sgc8-F20 or Control-F23 was injected through the tail vein; n = 3.(C) The distribution of the sgc8 and Sgc8-F23 in tumor and major organs (heart, liver, spleen, lung and kidney) at 54 h after injection visualized by fluorescence imaging; n = 3. (D) The representative fluorescent micrographs of the distribution of the sgc8 and Sgc8-F23 in the tumor at tissue level 54 h after injection were examined by confocal microscopy. Sgc8 and Sgc8-F23 were indicated by Cy5 (red). The nucleus was indicated by DAPI (blue). Scale bars, 20 μm.

