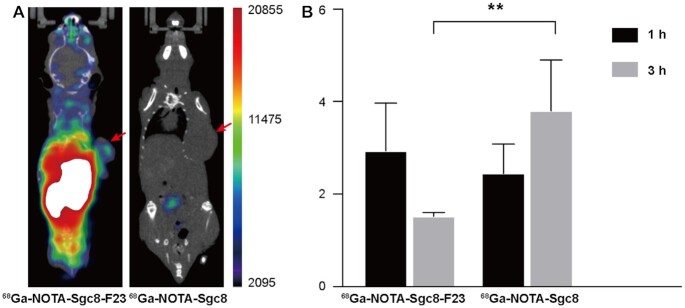
Figure 6.
PET/CT imaging. (A) PET imaging of mice bearing subcutaneous HCT116 xenograft injected with 68Ga-NOTA-Sgc8 and 68Ga- NOTA-Sgc8-F23 at 4 h; Red arrow indicates the site of the tumor. (B) The distribution of the sgc8 and Sgc8-F23 in the tumor at 1 and 3 h after injection was measured by a γ-counter, and the results were presented as a percentage of injected dose per gram of tissue (%ID/g). n = 3, error bars denote standard deviation.

