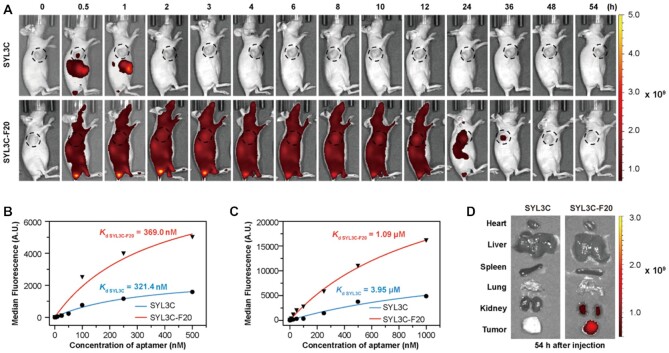
Figure 7.
In vivo and in vitro studies of SYL3C and F-SYL3C. (A) In vivo fluorescence imaging of HCT116 tumor-bearing mice after Cy5-labeled SYL3C or F-SYL3C was injected through the tail vein. n = 3. (B) Binding affinity analysis of SYL3C and F-SYL3C with HCT116 cells at 4°C. (C) Binding affinity analysis of SYL3C and SYL3C-F20 with HSA at room temperature. (D) The distribution of the SYL3C and SYL3C-F20 in tumor and major organs (heart, liver, spleen, lung and kidney) at 54 h after injection was visualized by fluorescence imaging; n = 3.

