Figure 2.
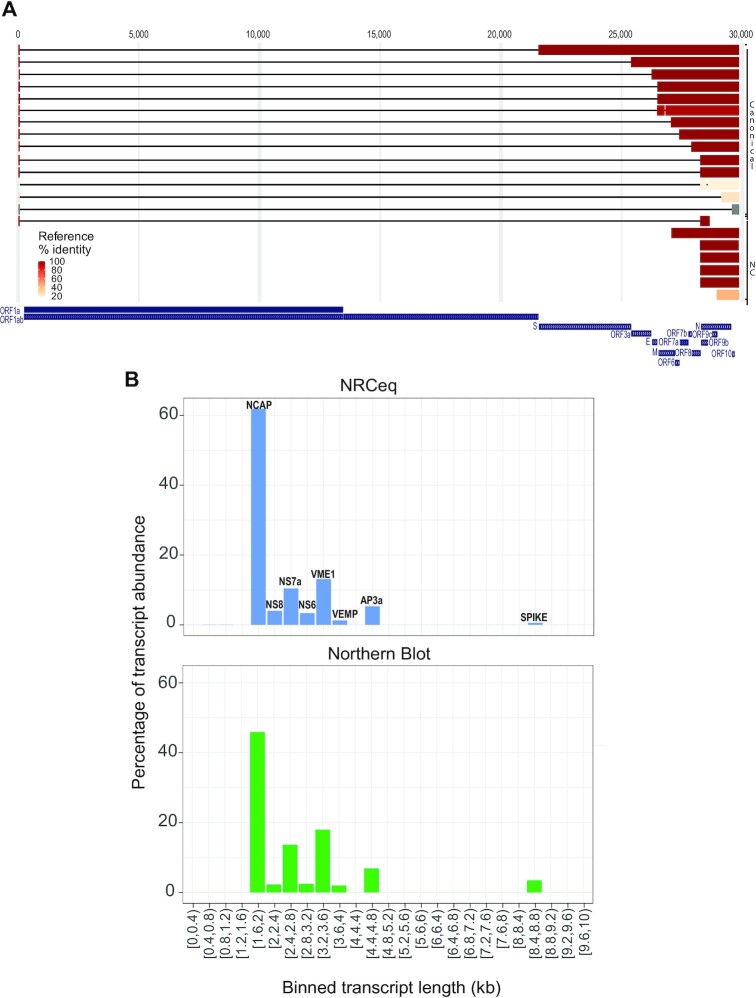
NRCeq assembly identifies and quantifies viral sgRNAs. (A) UCSC Genome Browser track showing the SARS-CoV-2 transcriptome assembly obtained with NRCeq data. The figure reports both canonical and non-canonical (NC) transcript models. SARS-CoV-2 ORFs are reported for reference. The colour coding indicates the number of identical amino acids between the first ORF of the sgRNA and the best match in the reference SARS-CoV-2 proteome (Uniprot) expressed as a fraction of the reference protein's length. (B) Quantification of the ORFs performed by NRCeq and Northern Blot. NRCeq data from CaCo2 and Vero cells were aggregated in a single dataset. For each bin of 400nt (x-axis) the cumulative expression of all assembled transcript models was calculated and expressed as a percentage (y-axis). The northern blot quantification data was obtained from Ogando et al. (43).

