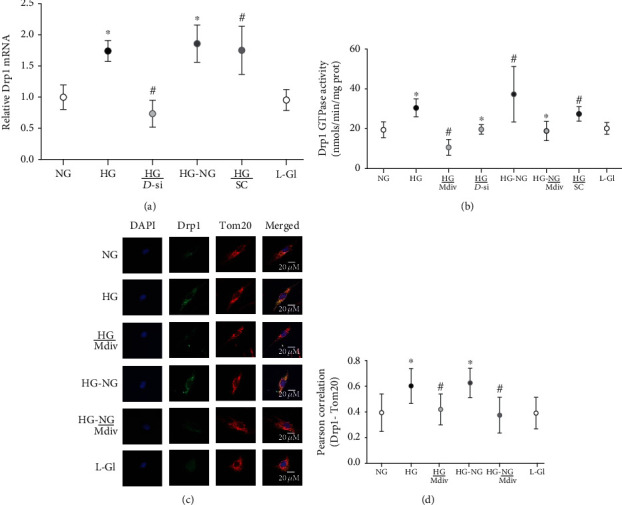
Figure 1.

Drp1 activation and its continued mitochondrial localization remain high even after reversal of high-glucose insult. Drp1 (a) mRNA, (b) GTPase activity, and (c) its mitochondrial localization of Drp1. Each image in (c) is a representative of 5-7 cells/group, repeated in 3 or more cell preparations, with Drp1 is in green and Tom20 in red. (d) Pearson correlation coefficient between Drp1-Tom20 was calculated from 25 to 30 cells in each group. The values in the graphs are represented as mean ± SD, obtained from 3 to 4 different cell preparations, with each measurement made in duplicate. NG and HG: HRECs in 5 mM or continuous 20 mM D-glucose, respectively; HG/Mdiv: HRECs in continuous 20 mM glucose with Mdiv; HG/D-si and HG/SC: Drp1-siRNA or control scrambled RNA transfected HRECs in continuous 20 mM glucose; HG-NG and HG-NG/Mdiv: HRECs in 20 mM D-glucose for four days followed by 5 mM glucose, without or with Mdiv, respectively, for four additional days; L-Gl: 20 mM L-glucose. ∗p < 0.05 vs. NG, #p < 0.05 vs. HG.
