Figure 4.

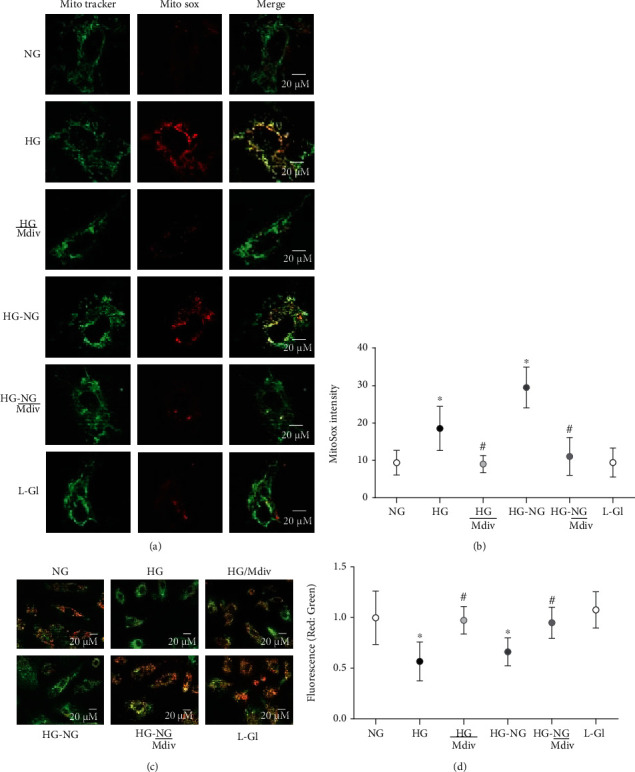
Amelioration of glucose-induced increase in mitochondrial ROS and membrane depolarization by Drp1 inhibition. (a) Cells stained with MitoSOX Red for mitochondrial ROS. (b) MitoSox fluorescence intensity, quantified using ImageJ, from 4 to 6 images in each group. (c) JC-1 staining of HRECs, green fluorescence represents the depolarized (monomer), and reddish-orange represents hyperpolarized (J aggregates) mitochondria. (d) Ratio of red and green fluorescence intensity in JC-1 stained cells. Each image is representative of more than 5-8 cells/group, and imaging was repeated in three different cell preparations. Mitosox intensity and the ratio of red to green fluorescence intensity are represented as mean ± SD. HG/Mdiv: HRECs in continuous 20 mM glucose in the presence of Mdiv; HG/D-si and HG/SC: Drp1-siRNA or control scrambled RNA transfected HRECs in continuous 20 mM glucose; HG-NG and HG-NG/Mdiv: HRECs in 20 mM D-glucose for four days followed by 5 mM glucose, without or with Mdiv, respectively, for four additional days; L-Gl: 20 mM L-glucose. ∗p < 0.05 vs. NG, #p < 0.05 vs. HG.
