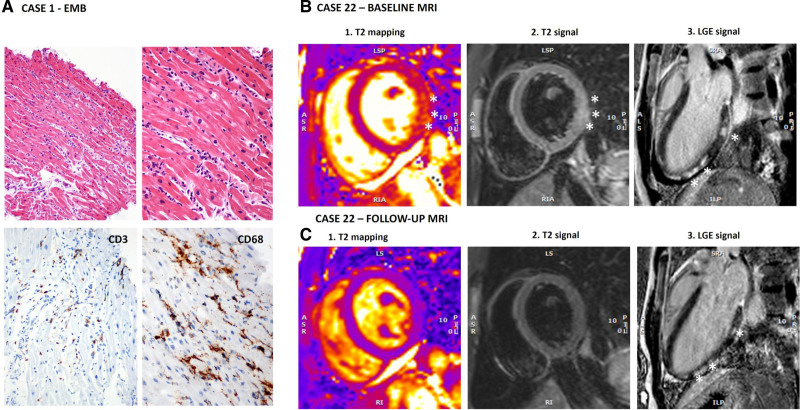
Figure 3.
Histological findings and cardiac magnetic resonance imaging (MRI) of 2 patients with COVID-19–associated acute myocarditis. A, Endomyocardial biopsy (EMB) findings from a 20-year-old male patient (case 1 in Table S2) show inflammatory infiltrates in the myocardium (upper images, hematoxylin and eosin images at 100× and 200× magnification) and positive CD3 and CD68 immunohistochemical stains (lower images, images at 200× magnification) revealing CD3+T-lymphocytes ≥7 cells/mm2 and CD68+macrophages ≥4 cells/mm2 consistent with myocarditis on the basis of European Society of Cardiology criteria. B, Baseline and follow-up cardiac MRI images at 1.5 Tesla of a 16-year-old boy (case 22) admitted to the hospital with acute myocarditis without pneumonia. Cardiac MRI at baseline fulfilled the 2018 Lake Louise Criteria for myocarditis because signs of both myocardial edema and nonischemic myocardial injury were present. T2-weighted images showed patchy areas of increased T2 signal intensity. In B, both T2 mapping (1) and short-tau inversion recovery (STIR) T2-weighted imaging (2) showed an area of increased signal intensity (SI) in the basal inferolateral wall (asterisks); in this area, T2 mapping value was 58 ms, whereas it was 43 ms in the septum, and the ratio between myocardial and skeletal muscle SI was elevated at 2.5. Postcontrast images (3) showed patchy late gadolinium enhancement (LGE) with nonischemic pattern in the inferolateral wall (asterisks). Pericardial effusion was also evident at cine images, whereas global systolic function was preserved (left ventricular ejection fraction [LVEF] 63%, Video S1). In C, follow-up images of the same patient at 6 months are shown. Compared with the scan acquired in the acute phase, there were no signs of myocardial edema: in the basal inferolateral wall, T2 mapping value decreased to 44 ms (1), and SI ratio between the myocardium and skeletal muscle at STIR T2-weighted images was <2 (2). Patchy LGE (asterisks) of the inferolateral wall persisted, although reduced (3). The pericardial effusion was still present, and systolic ventricular function improved (LVEF 69%; see Video S2). Of note, indexed myocardial mass also reduced from baseline to follow-up from 85 to 78 g/m2. Increased mass in the acute phase can represent an indirect sign of myocardial edema.

