
Figure 3.
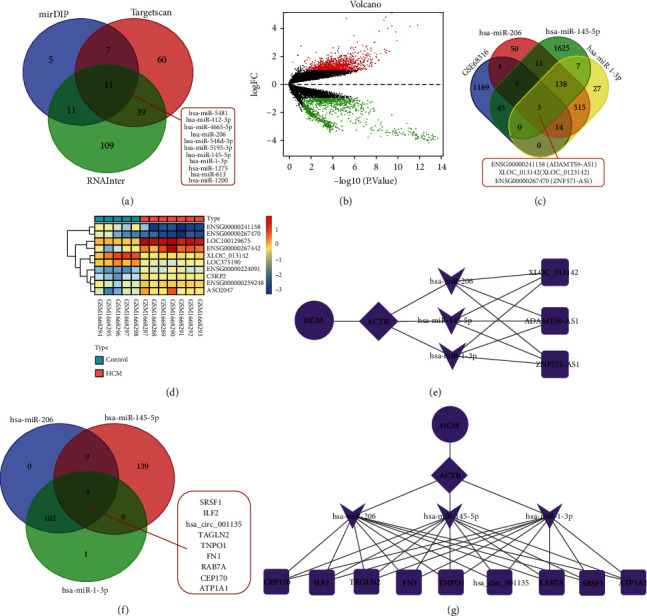
Screening of upstream miRNA, lncRNA, and circRNA of ACTB. (a) Venn diagram of screening results from mirDIP, TargetScan, and RNAInter databases. (b) The differentially expressed mRNA in the HCM samples and the normal samples in the GSE68316 dataset. Green dots indicate downregulation, red dots indicate upregulation, gray dots indicate no significant difference, and the horizontal axis represents the logarithmic value of the multiple (FC) of the difference between different groups at the base of 2, log2 (FC), and the vertical axis represents the negative logarithmic value of the P value for the significance test of the difference, which was -log10 (P value). (c) Venn diagram of the intersection of the prediction results of DIANA-LncBase and the downregulated lncRNAs in the GSE68316 dataset. (d) Heat map of the GSE68316 dataset. (e) The regulatory network of lncRNA-miRNA-ACTB plotted by the Cytoscape software. (f) Venn diagram of StarBase database prediction results. (g) The regulatory network of circRNA-miRNA-ACTB plotted by the Cytoscape software.