
Figure 1. IFN-β differently regulates LAG-3, TIM-3, PD-1 and TIGIT in human T cells.
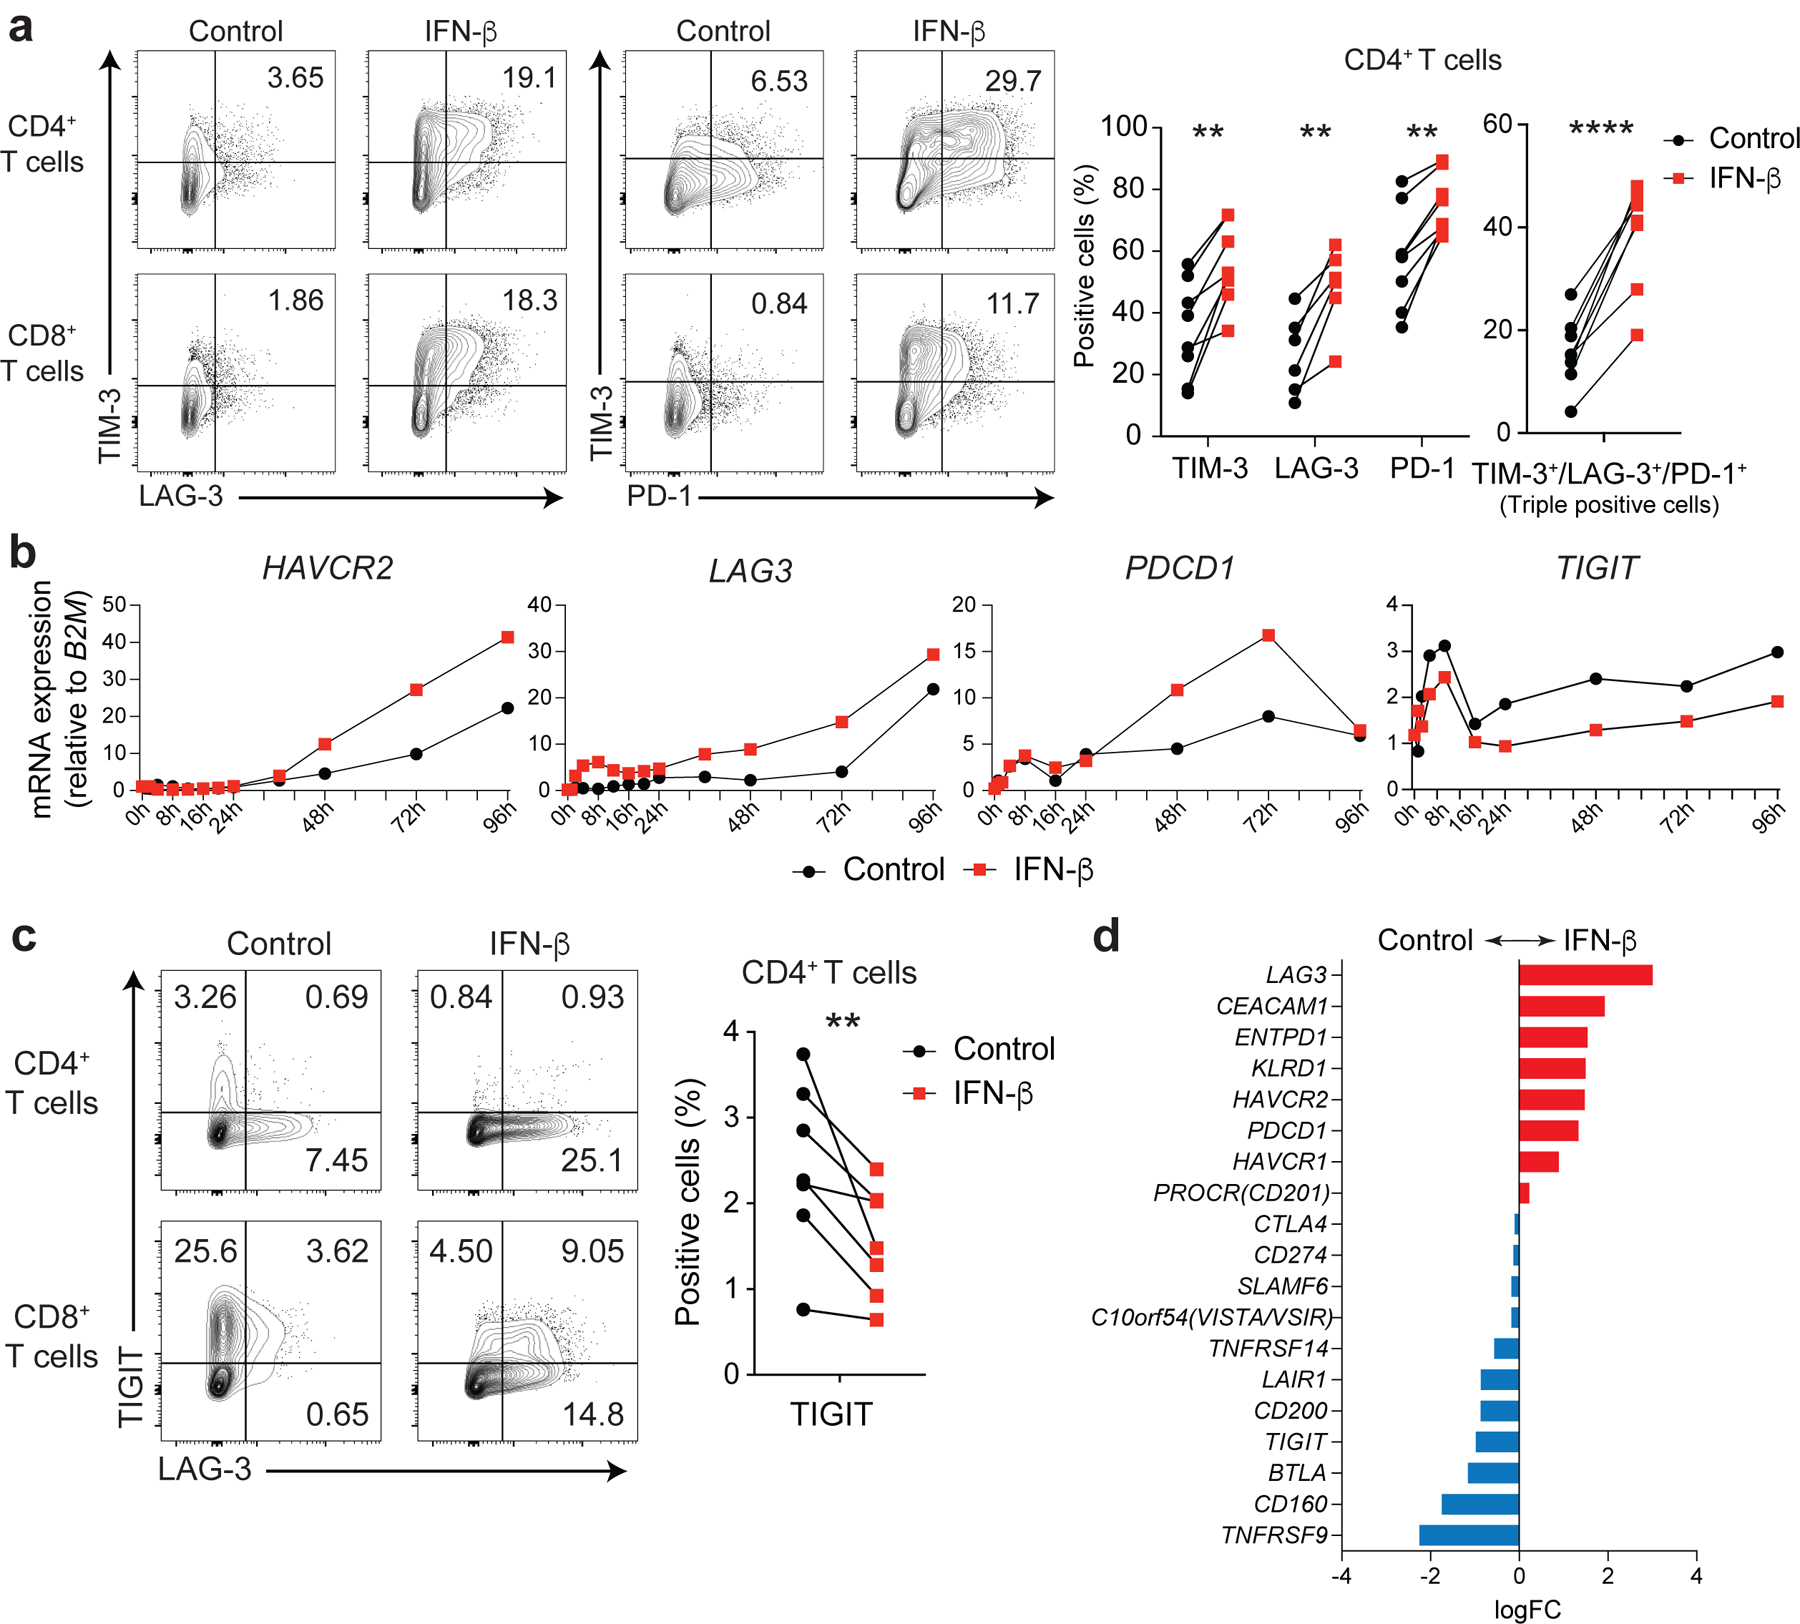
Effects of IFN-β on LAG-3, TIM-3, PD-1, and TIGIT expression on human naïve CD4+ and CD8+ T cells cultured with anti-CD3/CD28 for 96h in the absence (Control) or with 500 U/ml IFN-β (IFN-β). a, Representative contour plots of flow cytometry analysis on surface LAG-3, TIM-3, and PD-1 (left), quantitative expression for LAG-3, TIM-3, and PD-1 expression on naïve CD4+ T cells (n = 6; biologically independent samples) (middle), quantitative analysis for triple-positive (LAG-3, TIM-3, and PD-1) cells in naïve CD4+ T cells (n = 6; biologically independent samples) (right). b, Gene expression kinetics of LAG3, HAVCR2, PDCD1, and TIGIT quantified by qPCR with 13 timepoints in naïve CD4+ T cells. Average expression values from two subjects are plotted. c, IFN-β induces LAG-3 but suppresses TIGIT expression on human naïve CD4+ and CD8+ T cells. Representative contour plots of flow cytometry analysis (left), quantitative analysis for TIGIT positive cells in naïve CD4+ T cells (n = 8; biologically independent samples) (right). d, Co-inhibitory receptors expression pattern under IFN-β treatment in naïve CD4+ T cells by qPCR (n = 4; biologically independent samples). Red and blue bars represent higher expression in IFN-β treatment and Control conditions, respectively. Data was represented as mean +/− SD. **p < 0.01, ****p < 0.0001. Paired Student’s t test.