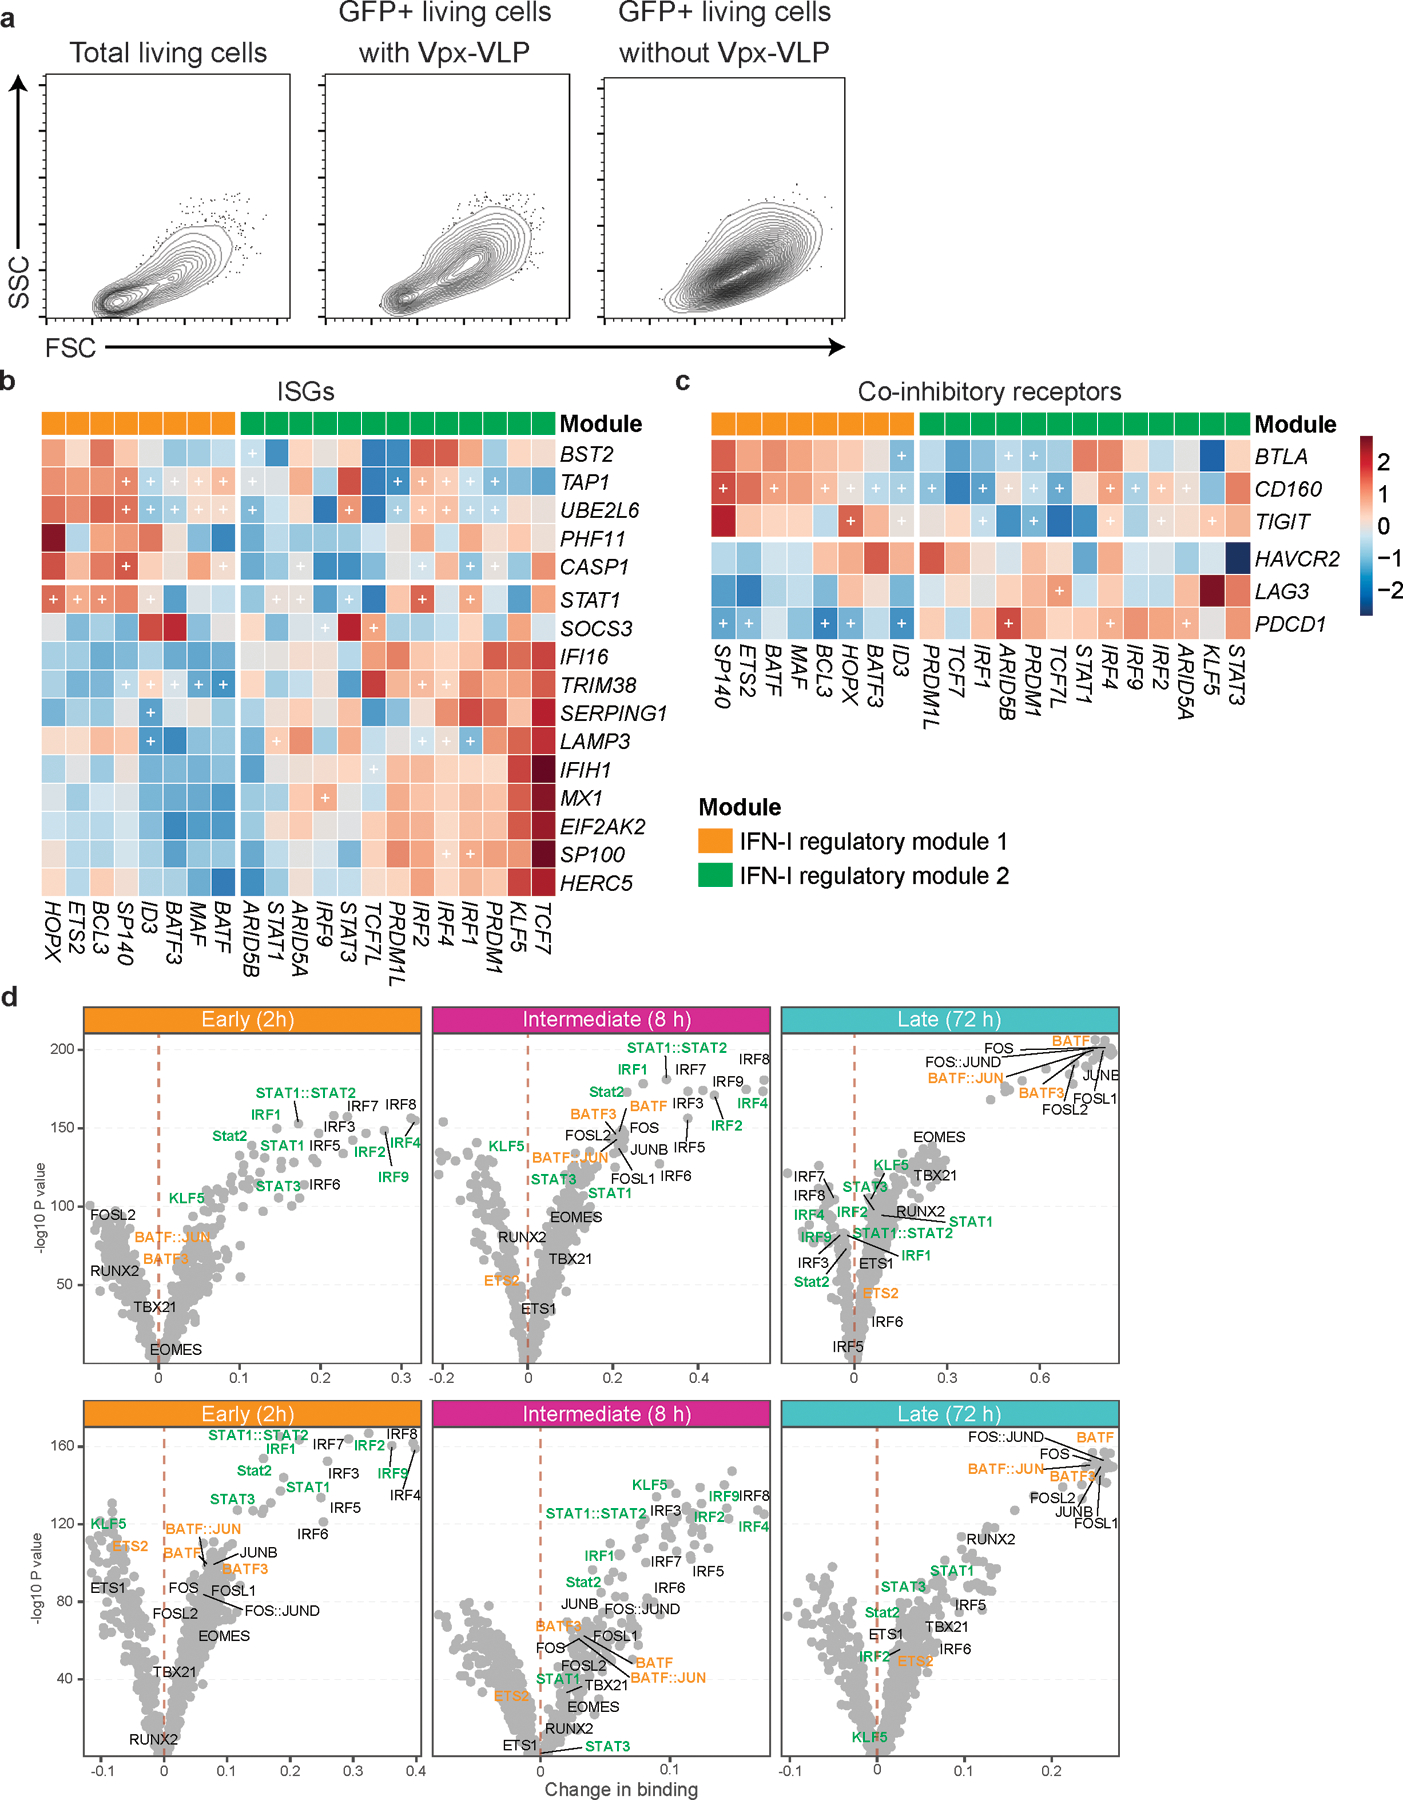
Extended Data Fig. 6. Two IFN-I regulatory modules govern both transcriptional and epigenetic changes during IFN-I response.

a, Contour plots for total living cells and backgating analysis for GFP positive cells. Primary naïve CD4+ T cells were transduced with scramble shRNA control LV with or without Vpx-VLPs pre-transduction. Cells are collected at 96 hours after starting stimulation and analyzed by flow cytometry. b, c, Heatmaps showing the effect of TFs perturbation under IFN-β stimulation on ISGs (b) and co-inhibitory receptors (c). Values in the heatmap were normalized by subtractions of log10 fold change of scramble shRNA control over perturbed expression. The “+” sign indicates a statistically significant effect with an adjusted P.value < 0.05 (details in Methods). d, Volcano plots depicting differential TF binding activity against the −log10(p value) (both provided by TOBIAS) of all investigated TF motifs; each dot represents one motif. Positive binding activity represents more enrichment in IFN-β treatment compared to control. The motifs for IFN-I regulator module 1 and IFN-I regulator module 2 were highlighted in orange and green, respectively.
