
Extended Data Fig. 8. IFN-I regulator expression profiles in T cells from COVID-19.
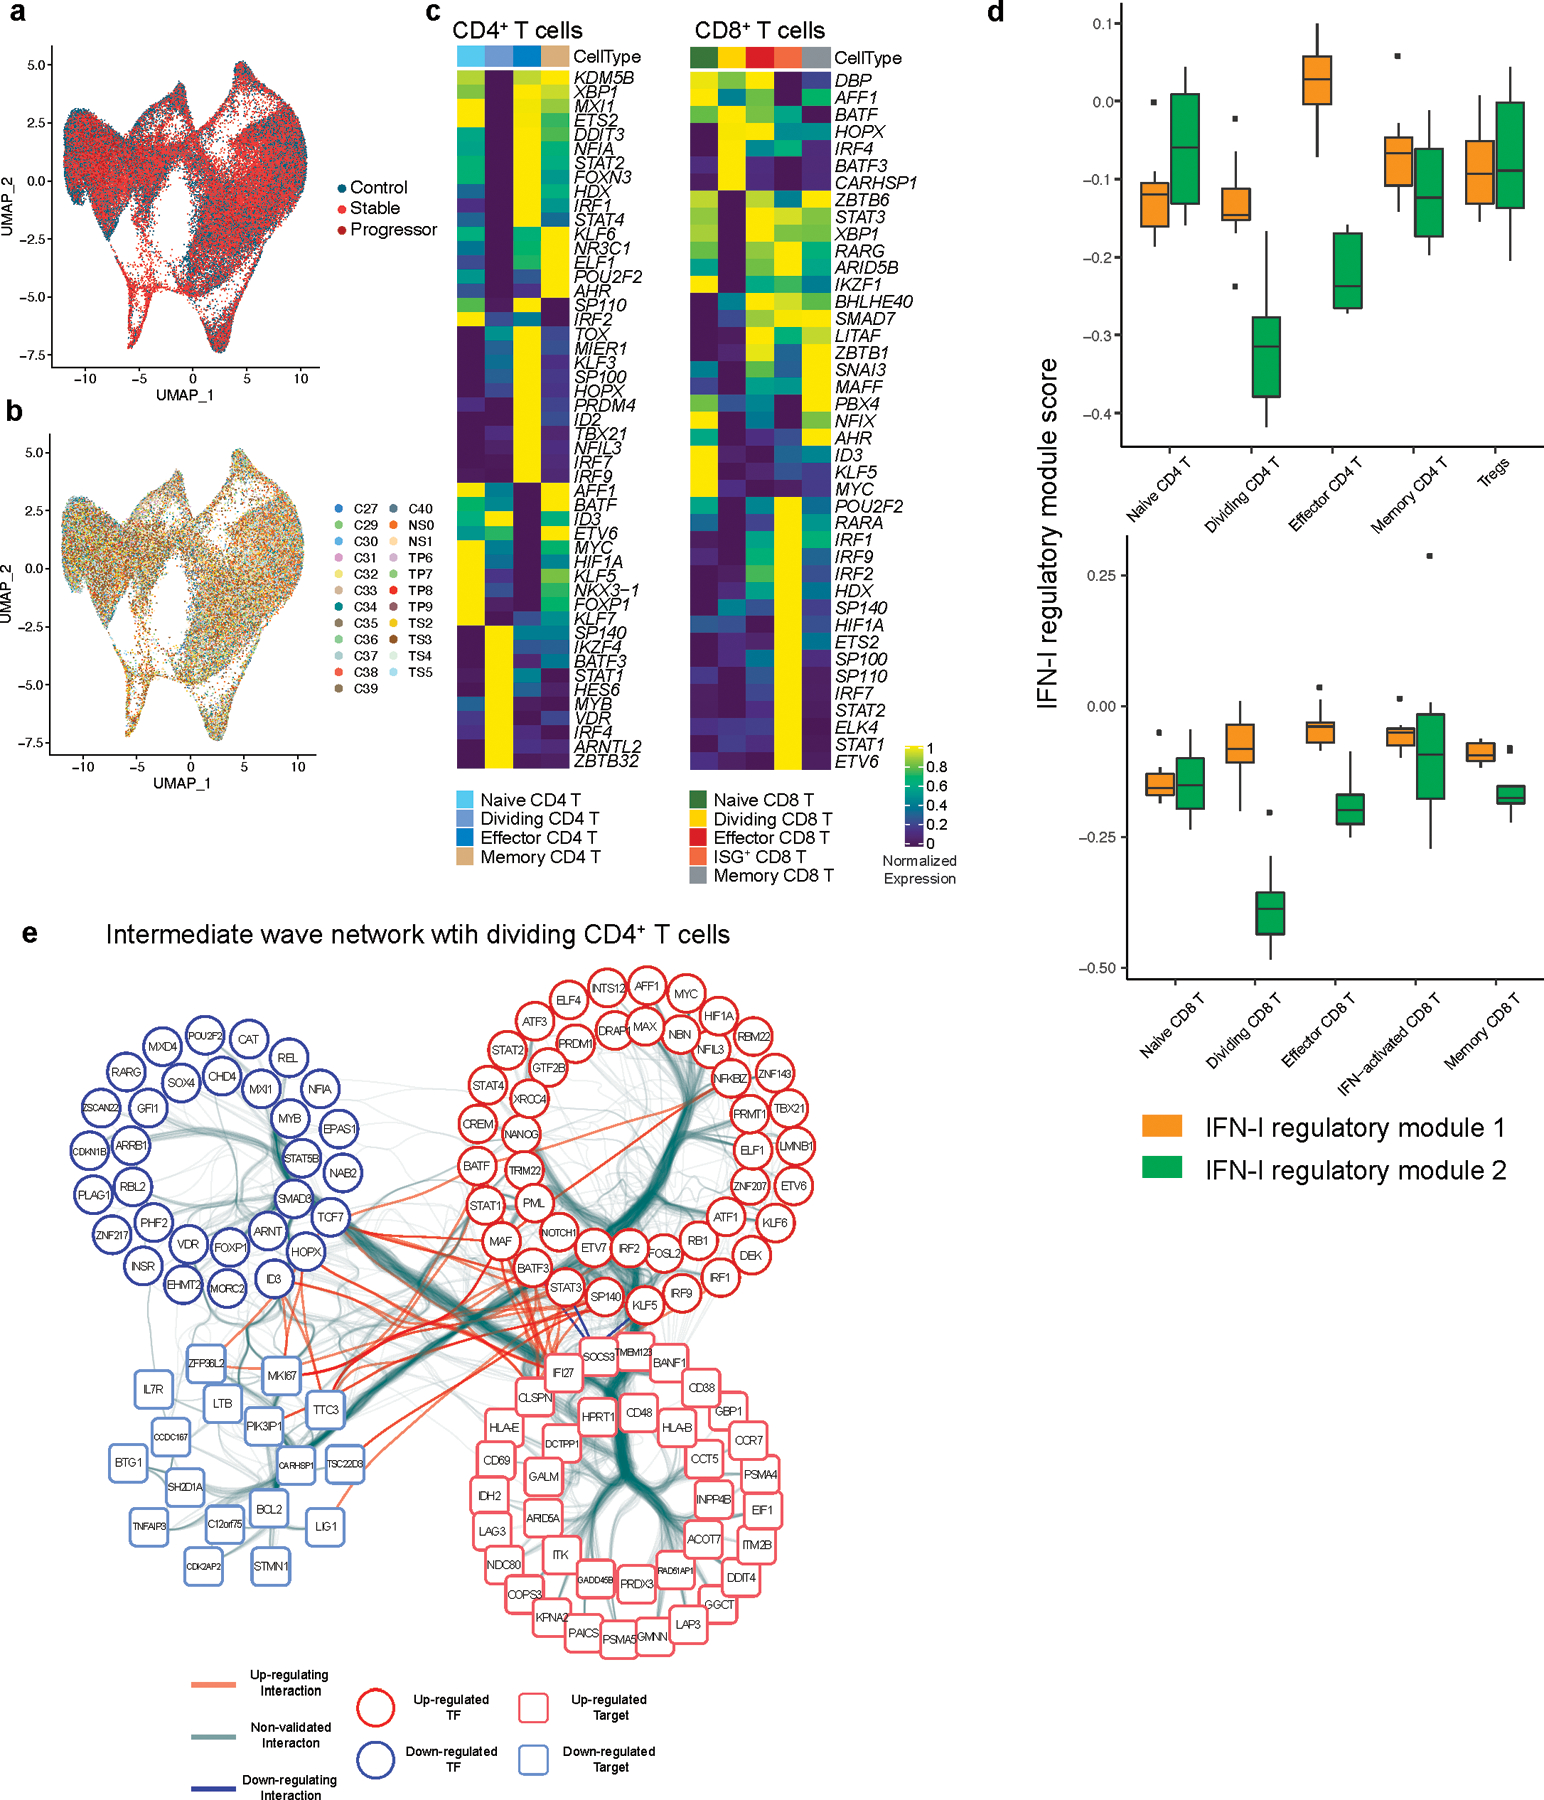
a, b, UMAP representation of T cells from healthy control samples (n = 13; biologically independent samples) and COVID-19 samples (n = 18; biologically independent samples) color coded by a, disease conditions and b, each individual. Cells from the same individual were labeled as one subject code, which resulted in 10 individual codes shown in b. c, Heatmap showing the expression of DETFs for CD4+ and CD8+ T cells in each T cell subset. d, IFN-I regulator module 1 and 2 scores for CD4+ and CD8+ T cells across sub cell types. e, Bundled regulatory network showing interactions between regulators at intermediate phase and transcriptional signature of dividing CD4+ T cells in COVID-19. Regulators at the intermediate phase are marked with circles (red; upregulated TFs, blue; downregulated TFs), and genes that are differentially expressed in dividing CD4+ T cells in COVID-19 were marked with squares (light red; upregulated DEGs, light blue; downregulated DEGs).