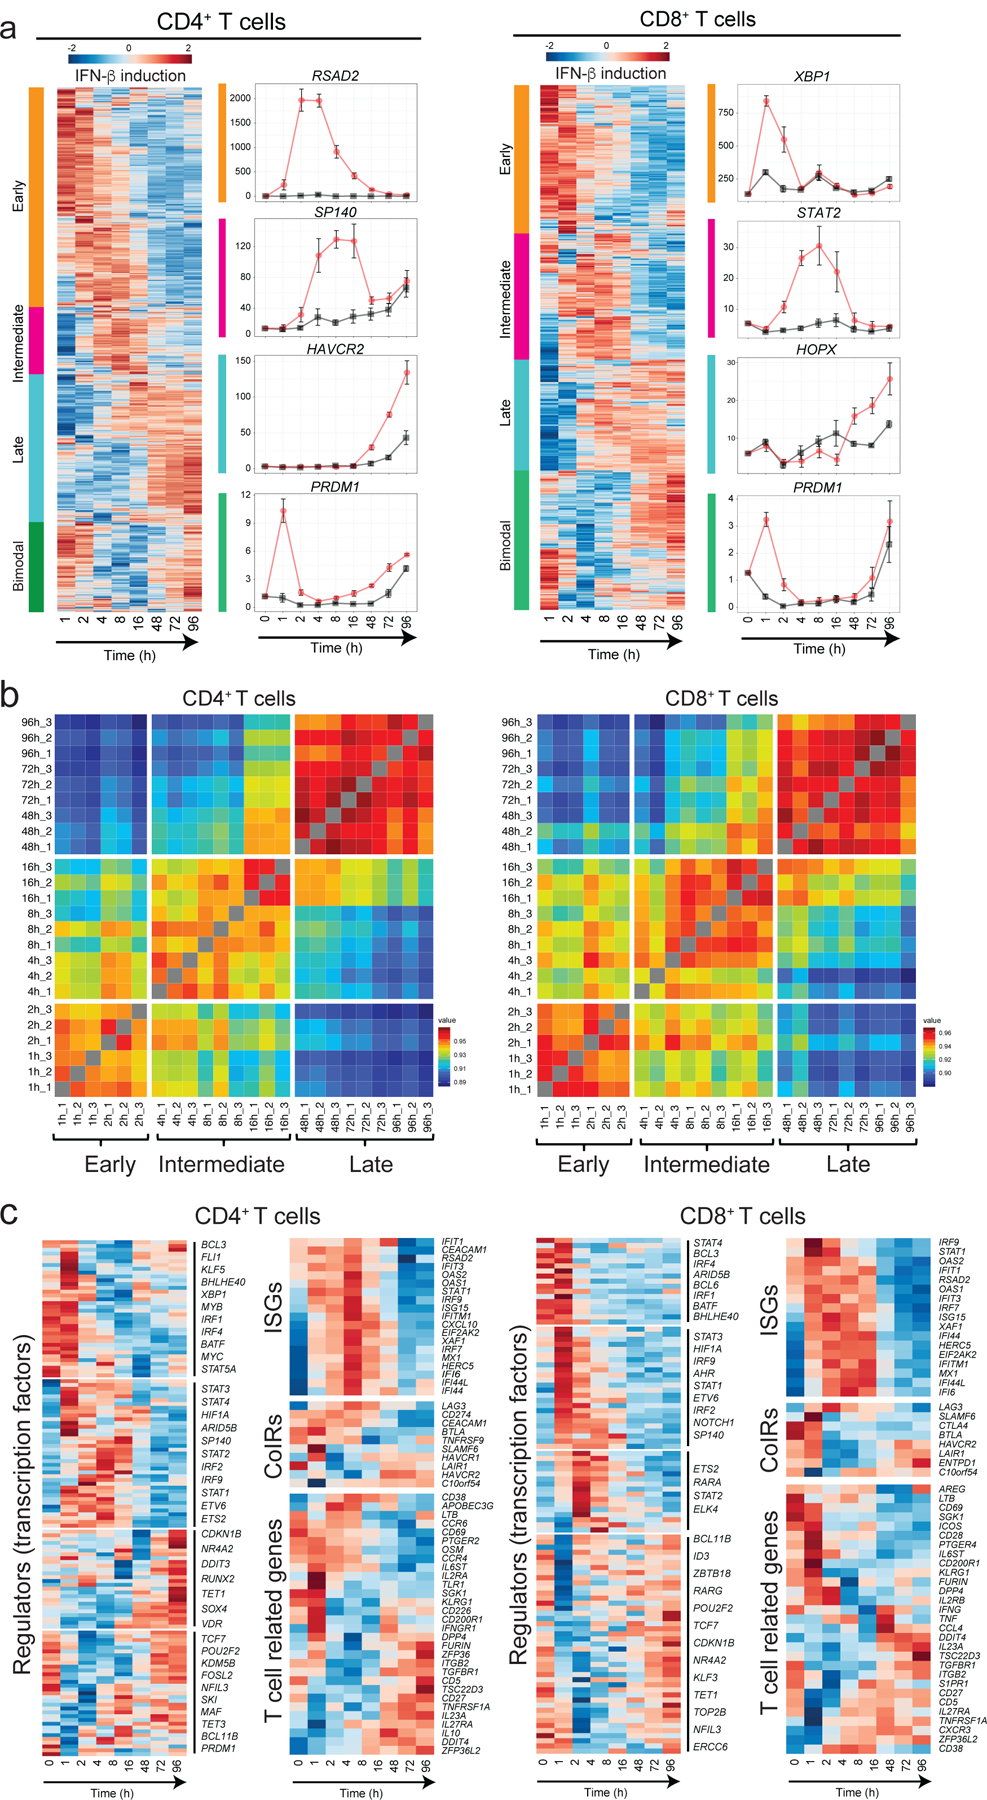
Figure 2. Three waves of dynamic transcriptomic changes by IFN-β in human T cells.

a, Gene expression profiles under IFN-β treatment in naïve CD4+ and CD8+ T cells. Differential expression of gene levels for eight time points with IFN-β stimulation (log2(expression)) are shown in heatmap. Based on the expression kinetics, the genes are clustered into four categories: early, intermediate, late, and bimodal (up regulated at early and late phase). Representative individual gene expression kinetics from each cluster are shown (mean+/− SD). b, Correlation matrix of global gene expression representing three transcriptional waves on CD4+ (left) and CD8+ T cells: early (1–2h), intermediate (4–16h), and late (48–96h). Eight timepoints with three replicates are shown. c, Temporal transcriptional profiles of differentially expressed genes for four categories are shown; transcriptional regulators (transcription factors), ISGs, co-inhibitory receptors, and key T cell associated factors for CD4+ (left) and CD8+ T cells.
