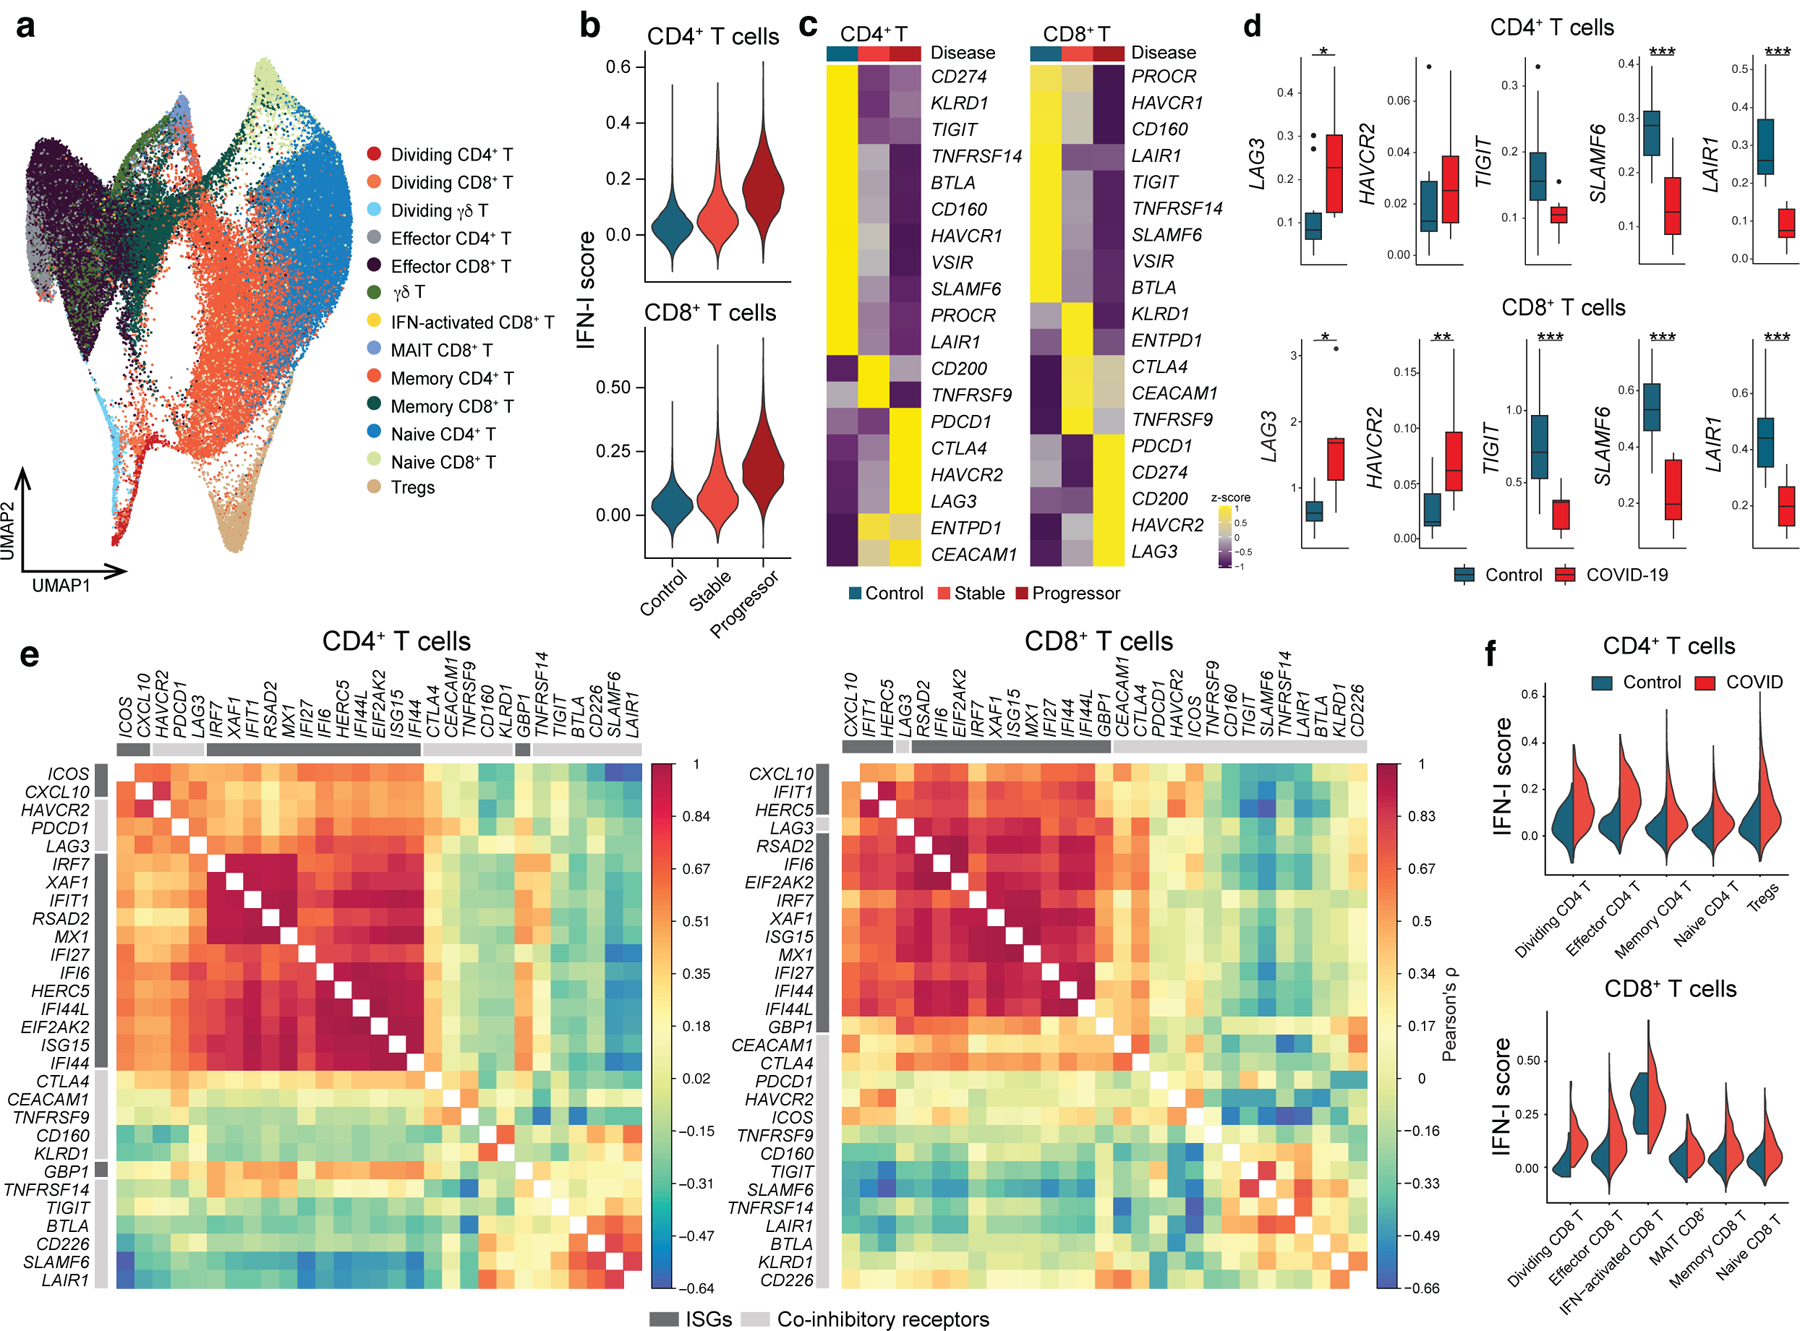
Figure 5. Linked IFN-I response and co-inhibitory receptor expression in T cells in COVID-19.

a, UMAP representation of T cells from healthy control samples (n = 13; biologically independent samples) and COVID-19 samples (n = 18; biologically independent samples). 13 subcluster were identified. b, IFN-I score for CD4+ and CD8+ T cells across the three disease conditions. c, Heatmaps for co-inhibitory receptors expression in CD4+ and CD8+ T cells across the three disease conditions. d, Expression of key co-inhibitory receptors between control vs COVID-19 for CD4+ and CD8+ T cells. Average expression per subject for each gene is shown. *p < 0.05, **p < 0.01, ***p < 0.001. Two-sided Kruskal-Wallis test. e, Correlation matrix of ISGs (dark gray) and co-inhibitory receptors (light gray) in CD4+ and CD8+ T cells in COVID-19 patients. f, IFN-I score for subsets of CD4+ and CD8+ T cells between control vs COVID-19.
