
Figure 6. Integration of IFN-I regulatory network with T cell signature in COVID-19.
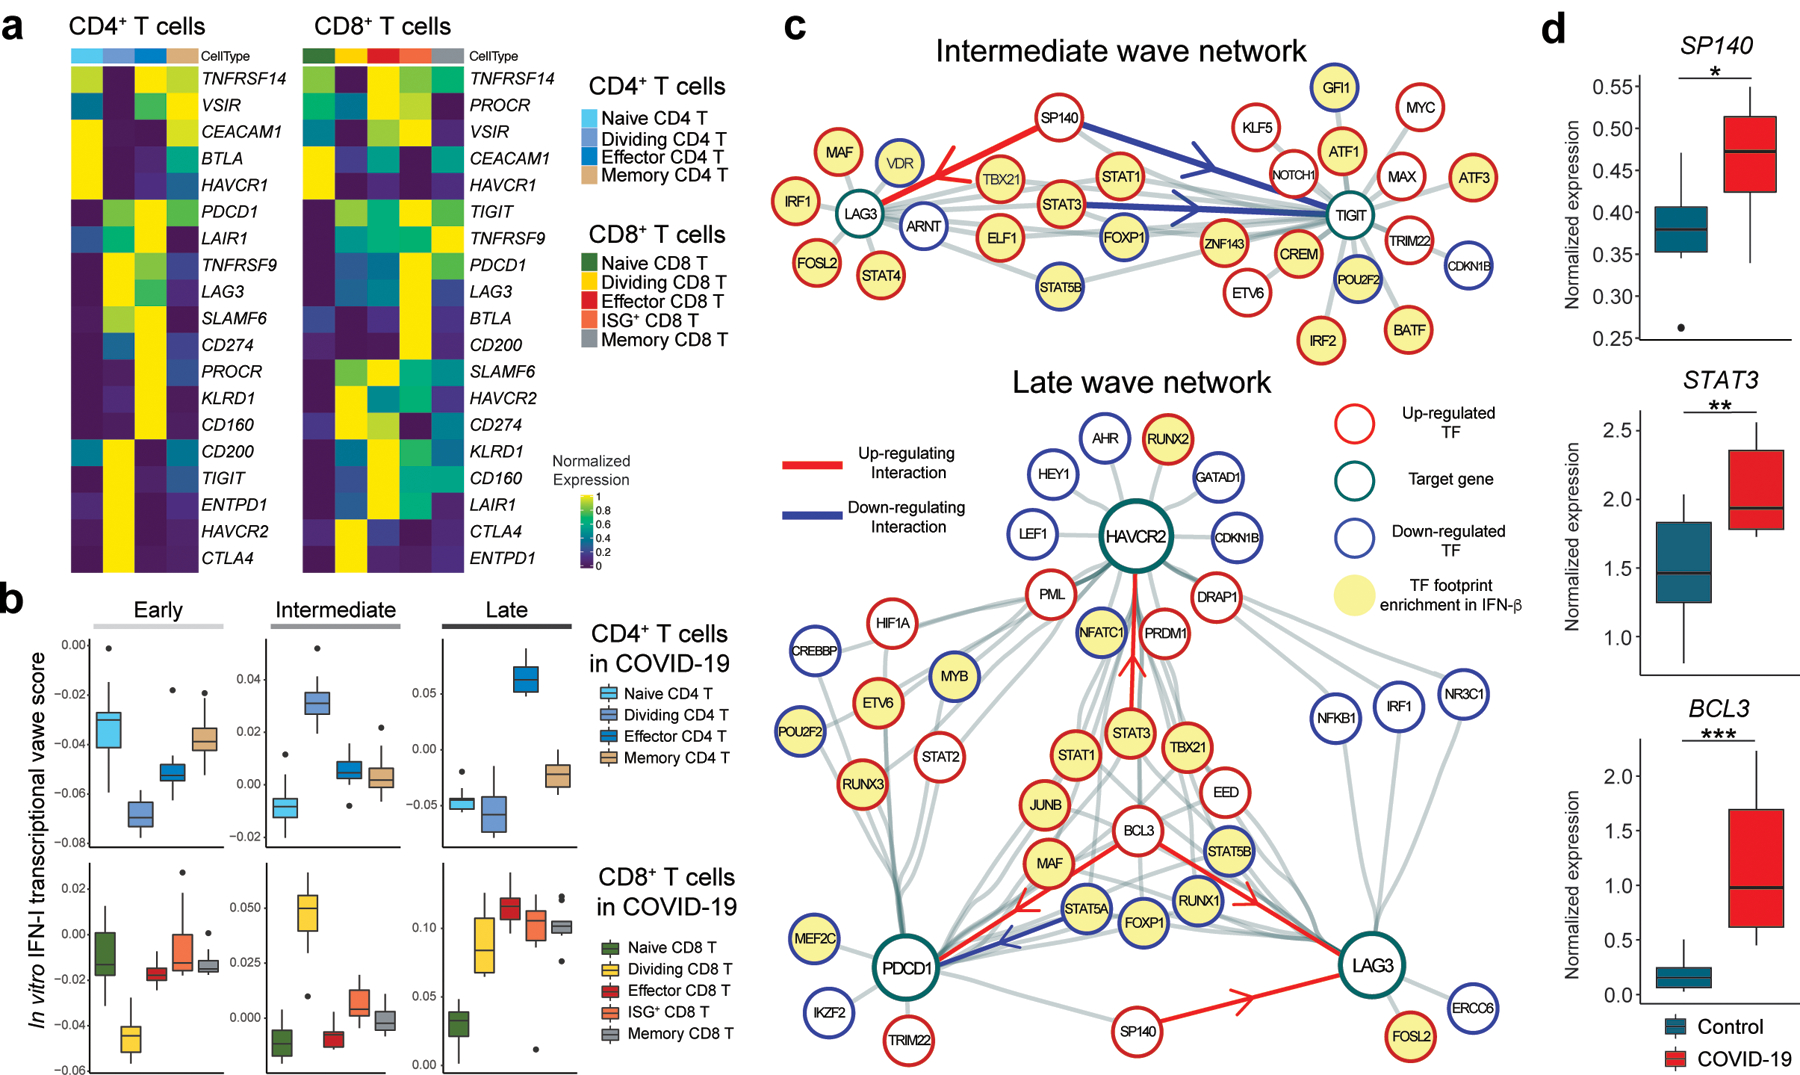
a, Heatmap showing co-inhibitory receptors expression for subsets of CD4+ and CD8+ T cells in COVID-19. b, Computed three transcriptional waves (early, intermediate, and late) score for the subsets of CD4+ and CD8+ T cells in COVID-19 patients. Scores were calculated based on upregulated DEGs of CD4+ and CD8+ T cells for each transcriptional wave. c, Regulatory relationship between regulators in intermediate phase network for LAG3 and TIGIT (top) and late phase network for LAG3, HAVCR2, and PDCD1 (bottom) are shown. Positive regulation (TF to target) is highlighted in red and negative regulations in blue. TF footprints enriched in IFN-β condition were highlighted in yellow. d, Box plots showing expression of key regulators between control vs COVID-19 for CD4+ T cells. Average expression per subject for each gene is shown. *p < 0.05, **p < 0.01, ***p < 0.001. Two-sided Kruskal-Wallis test.