
Extended Data Fig. 2. IFN-β differently regulates co-inhibitory receptors in human T cells.
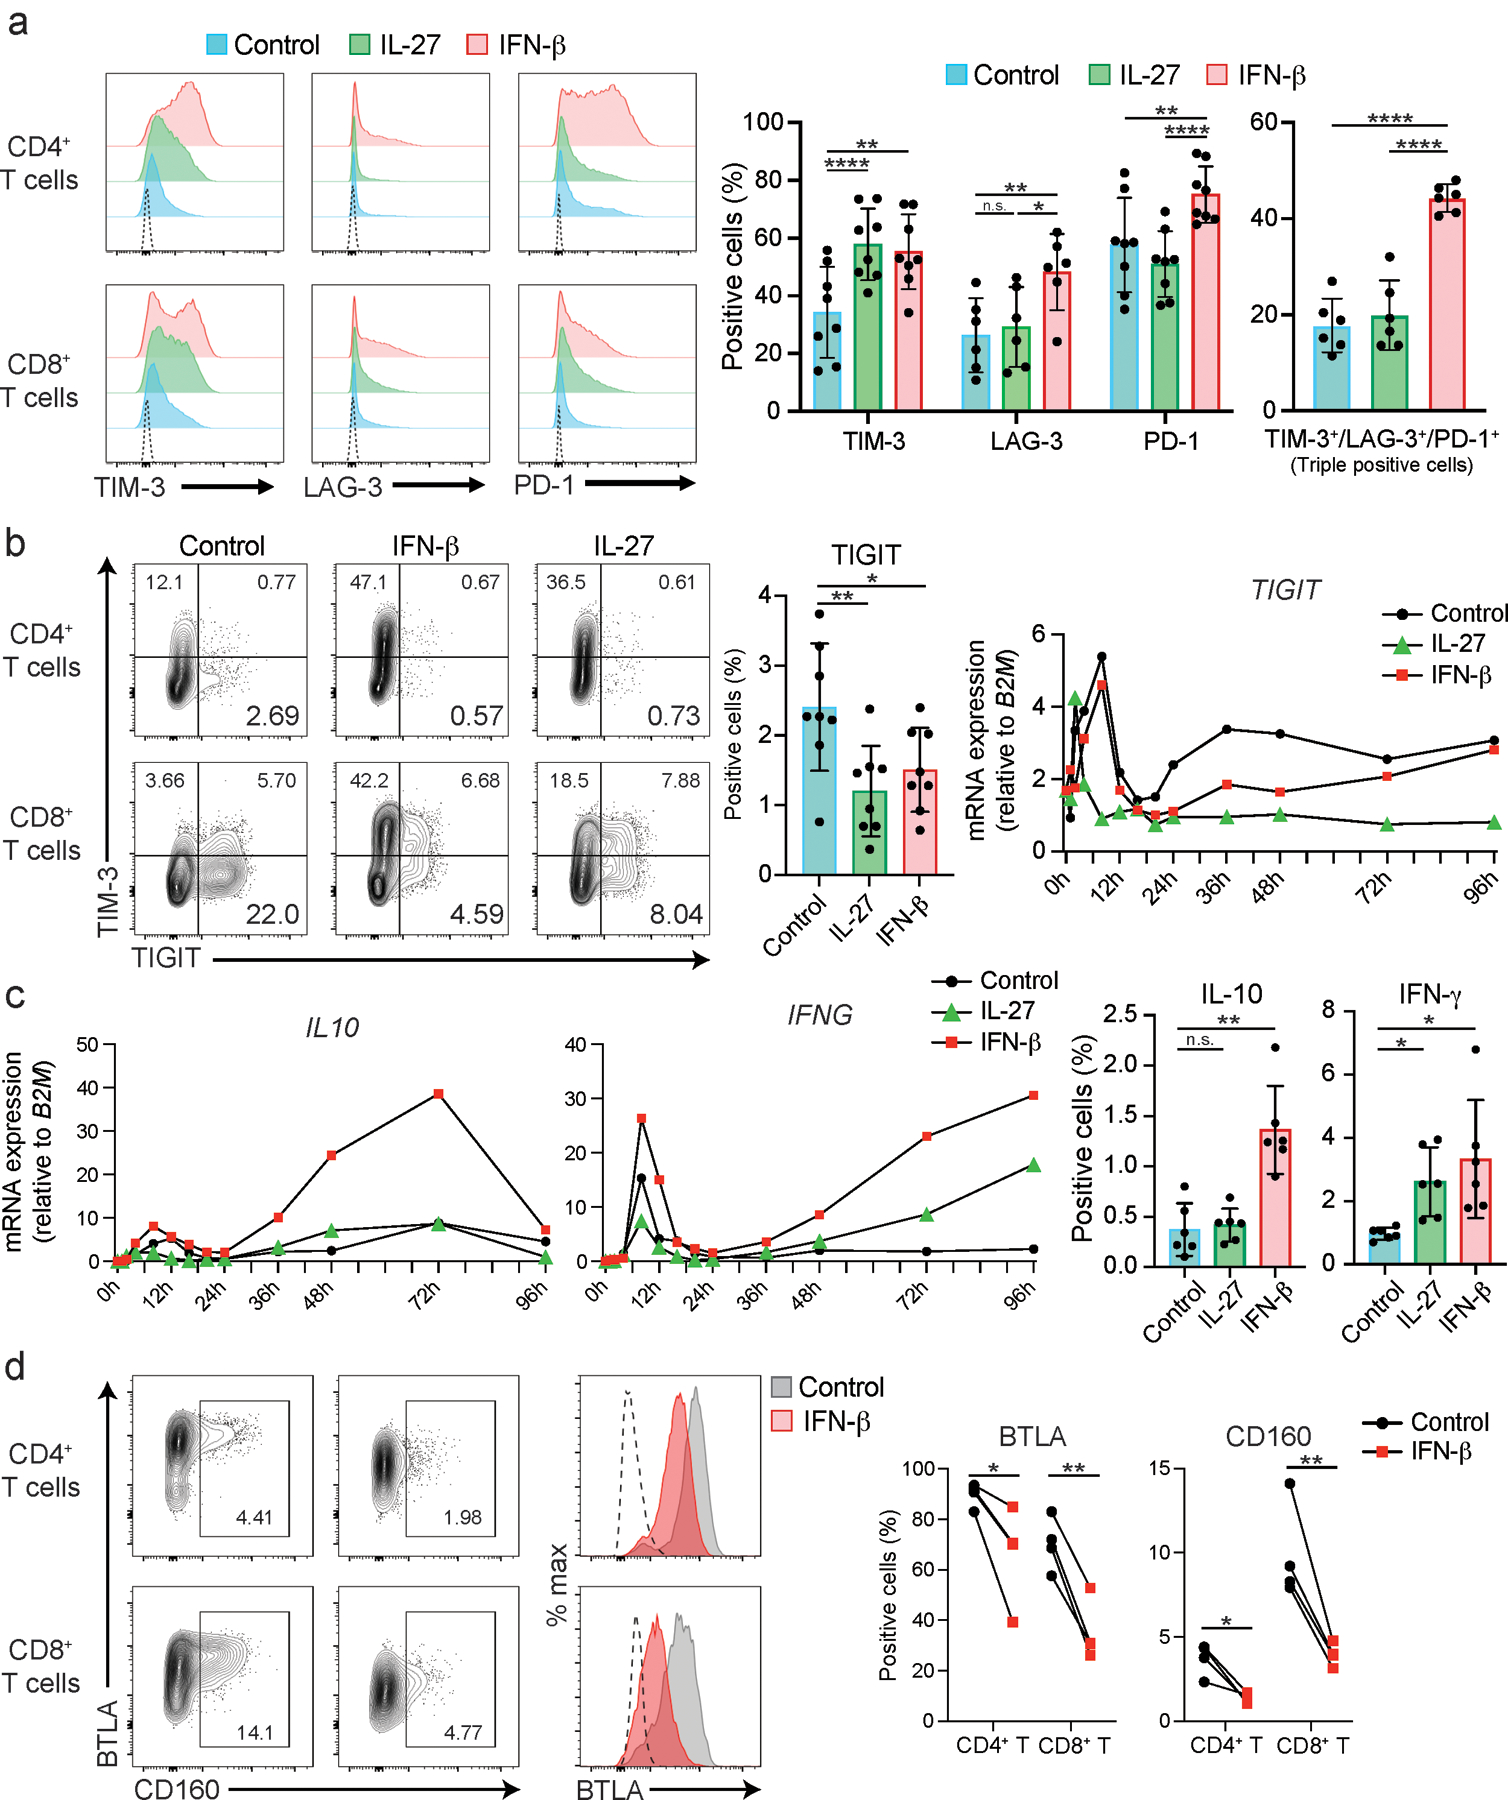
a, Representative histograms of surface expression of TIM-3, LAG-3, and PD-1 assessed by flow cytometry at 72–96 hours after stimulation. Dotted lines represent isotype control staining. Percent single positive cells for TIM-3, LAG-3, and PD-1 (middle) and triple positive cells (right) are shown (n = 6–8; biologically independent samples). *p < 0.05, **p < 0.01, ****p < 0.0001. b, Representative contour plots of flow cytometry analysis for TIM-3 and TIGIT expression in naïve CD4+ and CD8+ T cells (left). Cells were treated as Extended Data 1 and analyzed at 72 hours of culture. Percent TIGIT positive cells in naïve CD4+ T are shown (n = 8; biologically independent samples). *p < 0.05, **p < 0.01. (middle). qPCR analysis of TIGIT expression over the time course (13 time points from 0 to 96 hours). Each dot represents the average expression of two independent individuals’ data. ****p < 0.0001. c, qPCR analysis of IL10 and IFNG expression over the time course (13 time points from 0 to 96 hours). Each dot represents the average expression of two independent individuals’ data (left). IL-10 and IFN-γ production assessed by intracellular staining (right). Cells are treated as in a, and cytokines are stained intracellularly. Cytokine positive cells are detected by flow cytometry (n = 6; biologically independent samples). d, Representative contour plots of flow cytometry analysis for CD160 and BTLA expression and overlayed histogram for BTLA expression in naïve CD4+ and CD8+ T cells (left). Cells were treated as outlined in b and analyzed at 72 hours of culture. Percent positive cells for CD160 and BTLA in naïve CD4+ T are shown (n = 8; biologically independent samples) (right). *p < 0.05, **p < 0.01. Repeated-measures one-way ANOVA with Tukey’s multiple comparisons test (a-c), and paired student’s t-test (d).