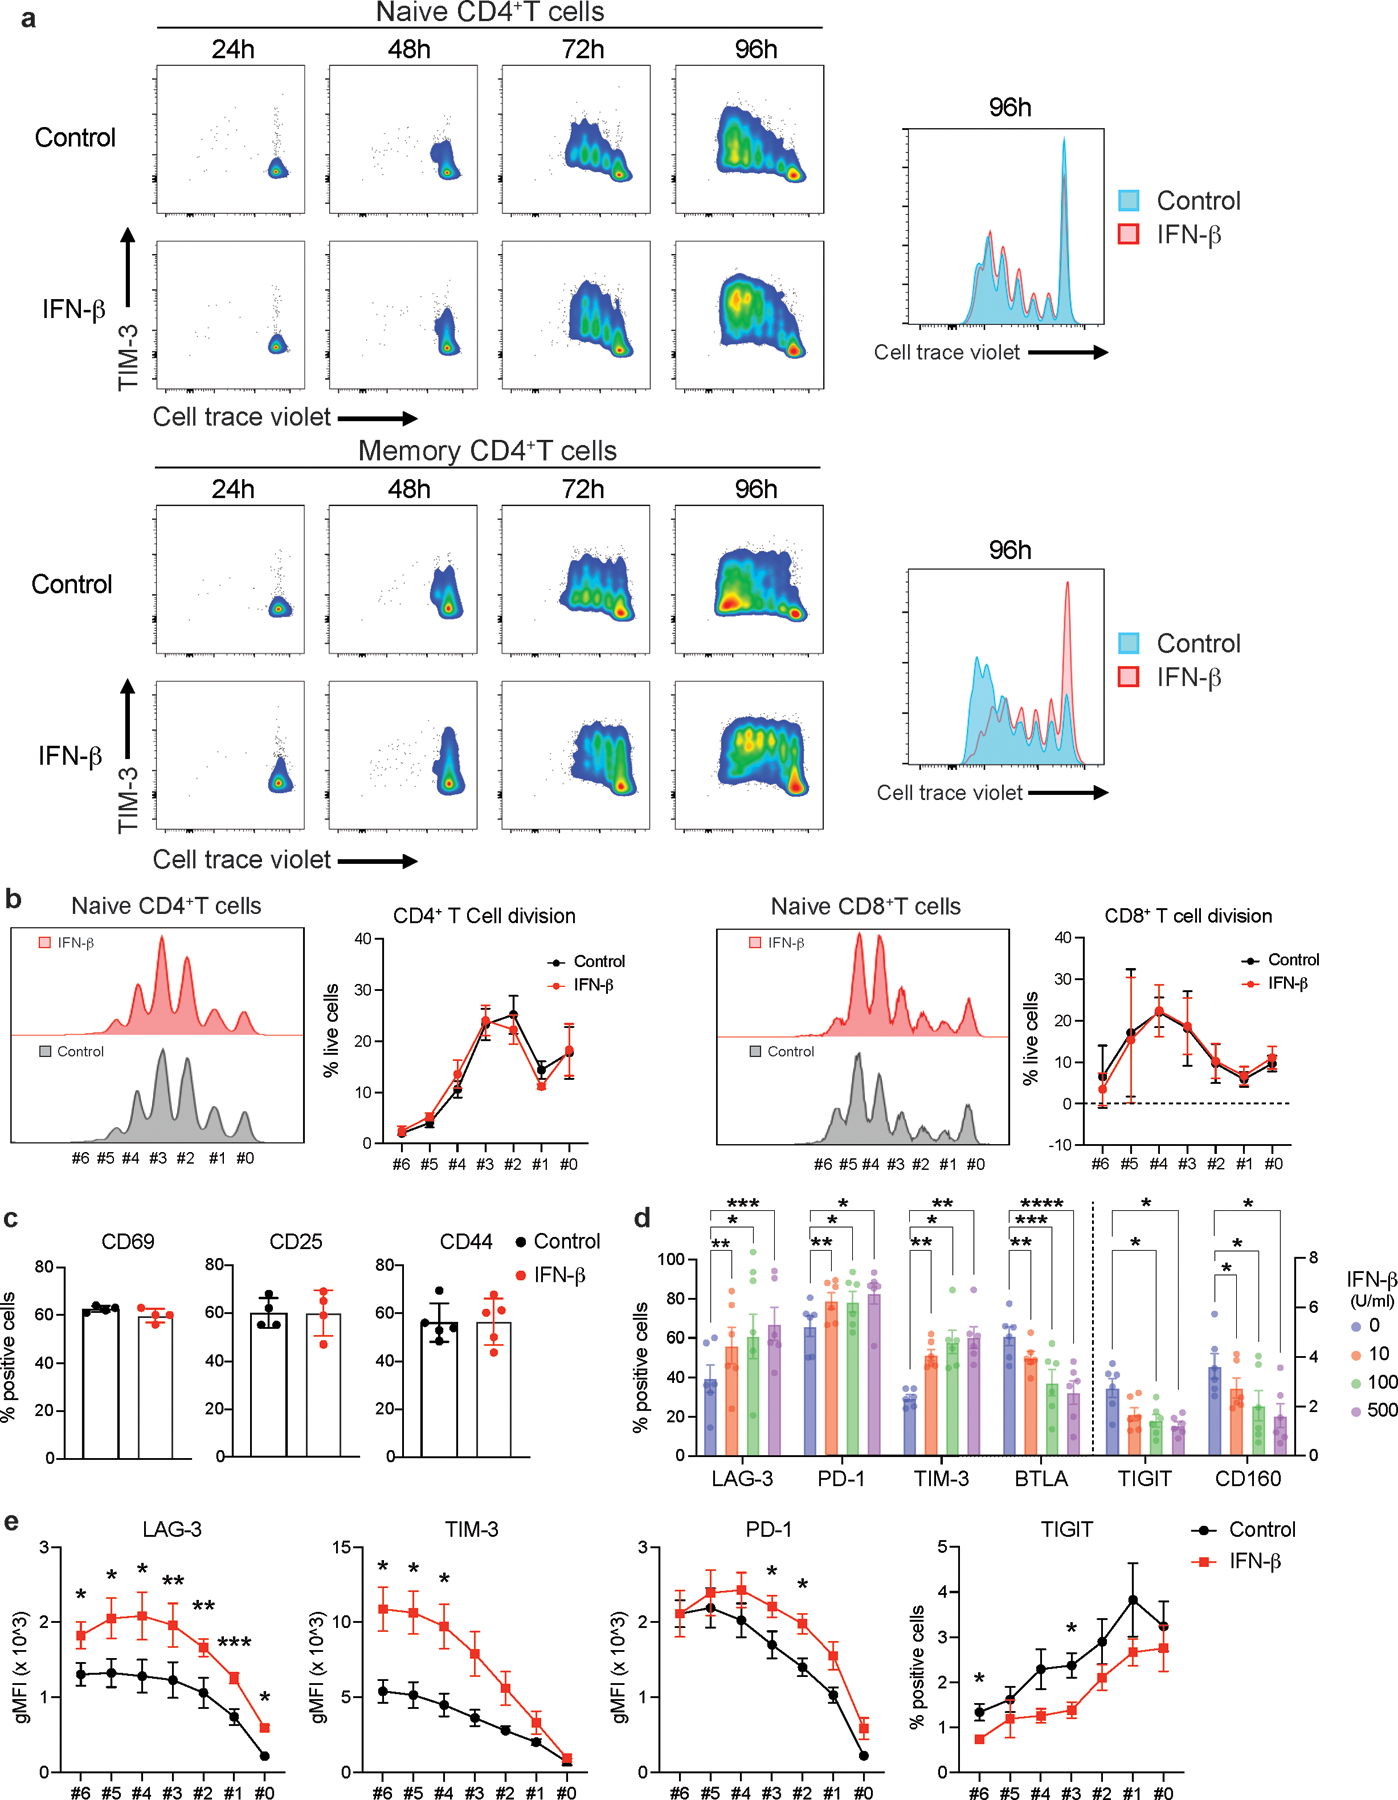
Extended Data Fig. 3. The impact of IFN-β on co-inhibitory receptors is not associated with T cell activation.

a, Representative plots for T cell proliferation assay using cell trace violet dye. Naive and memory CD4+ T cells were stimulated with anti-CD3 and anti-CD28 in the absence or presence of IFN-β. TIM-3 expression and cellular proliferation were assessed at 24, 48, 72, and 96 hours after stimulation. Overlayed histogram for control and IFN-β condition were shown at right. b, Frequency of living cells at each cellular division state was calculated in naïve CD4+ T cells (left) and naïve CD8+ T cells (right) at 96 hours. There is no statistical difference observed between control vs IFN-β condition (n=5; biologically independent samples). c, T cell activation markers (CD44, CD25, CD69) were quantified by flow cytometry in naïve CD4+ T cells at 96 hours. There is no statistical difference observed between control vs IFN-β condition (n=4–5; biologically independent samples). d, Dose dependent effects of IFN-β on co-inhibitory receptors assessed by flow cytometry (n=6; biologically independent samples). *p < 0.05, **p < 0.01, ***p < 0.001, ****p < 0.0001. Two-way ANOVA with Dunnett’s multiple comparisons test. e, LAG-3, PD-1, TIM-3, and TIGIT expressions were assessed by flow cytometry at each cellular division state (n=4; biologically independent samples). *p < 0.05, **p < 0.01, ***p < 0.001. Paired t test at each time point. Data was represented with mean +/− SEM.
