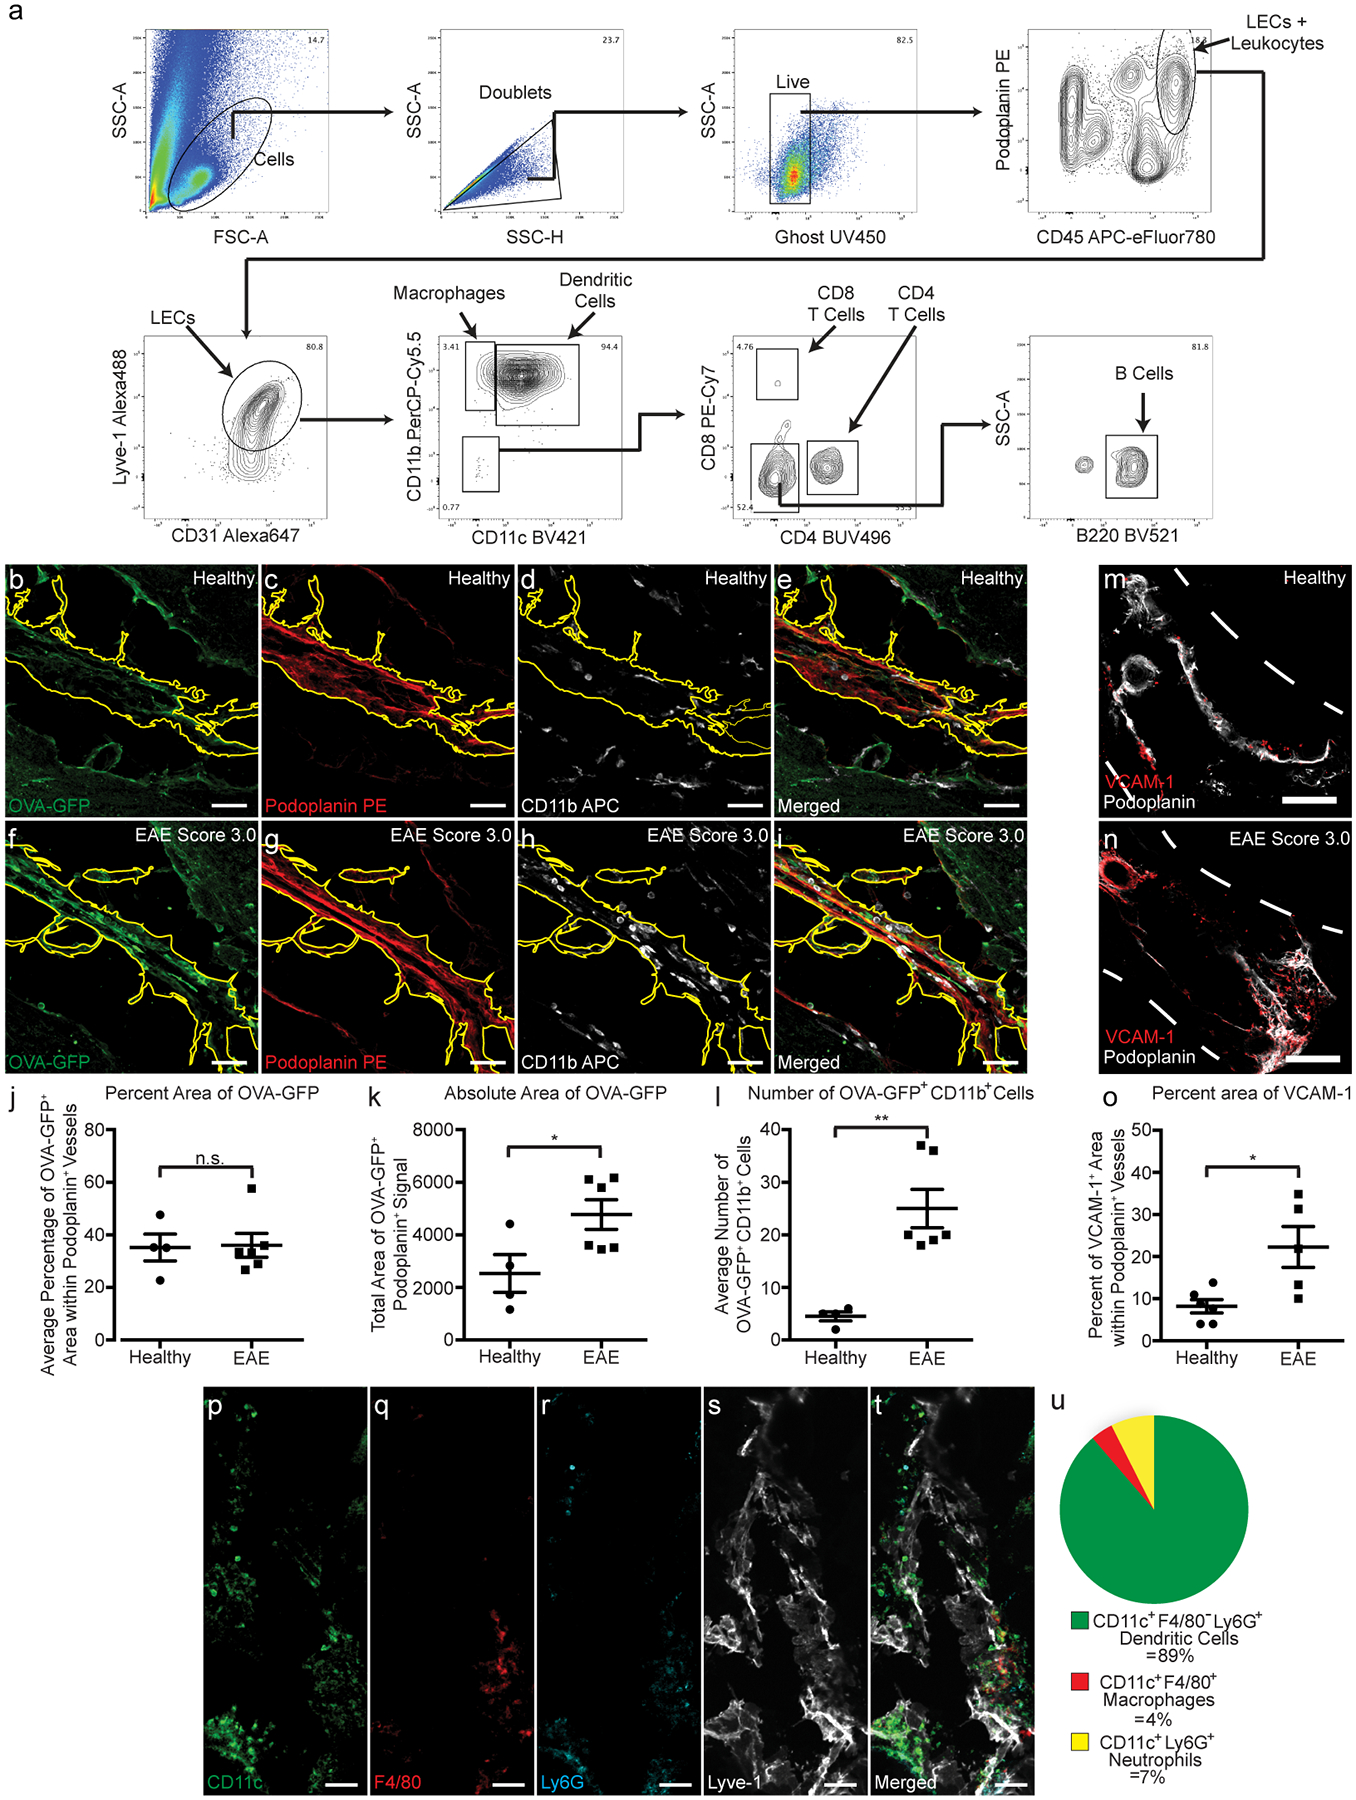
Extended Data Fig. 4. Characterizing cpLEC-leukocyte doublets.

(a): Gating strategy used to visualize leukocyte – LEC binding. Live Ghost UV450− doublets were gated for, and a leukocyte bound to a LEC were gated for both the leukocyte marker CD45 and LEC markers Podoplanin, Lyve-1, and CD31. Leukocytes were further gated for CD11b+ macrophages, CD11b+ CD11c+ dendritic cells, CD4+ T cells, CD8+ T cells, and B220+ B cells.
(b-e): Representative confocal images taken of a healthy cribriform plate section immunolabeled with OVA-GFP (b), Podoplanin (c), CD11b (d), and merged (e). Scale bar = 50 μm
(f-i): Representative confocal images taken of an EAE score 3.0 cribriform plate section immunolabeled with OVA-GFP (f), Podoplanin (g), CD11b (h), and merged (i). Scale bar = 50 μm
(j): Quantitation of the average percent area of OVA-GFP within Podoplanin+ cpLECs after excluding CD11b+ area. n = 4 healthy mice, 6 EAE mice; data are represented as mean ± standard error of the mean. For percent area of OVA-GFP, p = 0.9079; unpaired Student’s t-test.
(k): Quantitation of the absolute area of OVA-GFP within Podoplanin+ cpLECs. n = 4 healthy mice, 6 EAE mice; data are represented as mean ± standard error of the mean. For absolute area of OVA-GFP, p = 0.0380; unpaired Student’s t-test.
(l): Quantitation of the average number of CD11b+ cells containing intracellular OVA-GFP within Podoplanin+ cpLECs. n = 4 healthy mice, 6 EAE mice; data are represented as mean ± standard error of the mean. For number of OVA-GFP+ CD11b+ cells, p = 0.0022; unpaired Student’s t-test
(m – o): Representative confocal images taken of the cribriform plate from healthy (m) or EAE score 3.0 at 15 days post-immunization (n) immunolabeled with VCAM-1 and Podoplanin. Scale bar = 200um
(o): Quantitation of the average percent area of Podoplanin+ meningeal lymphatic vessels near the cribriform plate that express Vcam-1. n = 6 mice per group; data are represented as mean ± standard error of the mean. For percent area of Vcam-1+ labeling within Podoplanin+ cells, p = 0.0152; unpaired Student’s t-test.
(p – u): Representative confocal images taken of an EAE score 3.0 cribriform plate section immunolabeled with CD11c (p), F4/80 (q), Ly6G (r), Lyve-1 (s), and merged (t). Quantitation reveals that during EAE, the majority of CD11c+ cells in contact with Lyve-1+ cpLECs are F4/80− and Ly6G−, with a relatively minor subset of CD11c+ cells identified as F4/80+ macrophages or Ly6G+ neutrophils (u). Scale bar = 50 μm
