
Extended Data Fig. 6. cpLECs upregulate CD31, Podoplanin, Lyve-1, and PD-L1 during EAE.
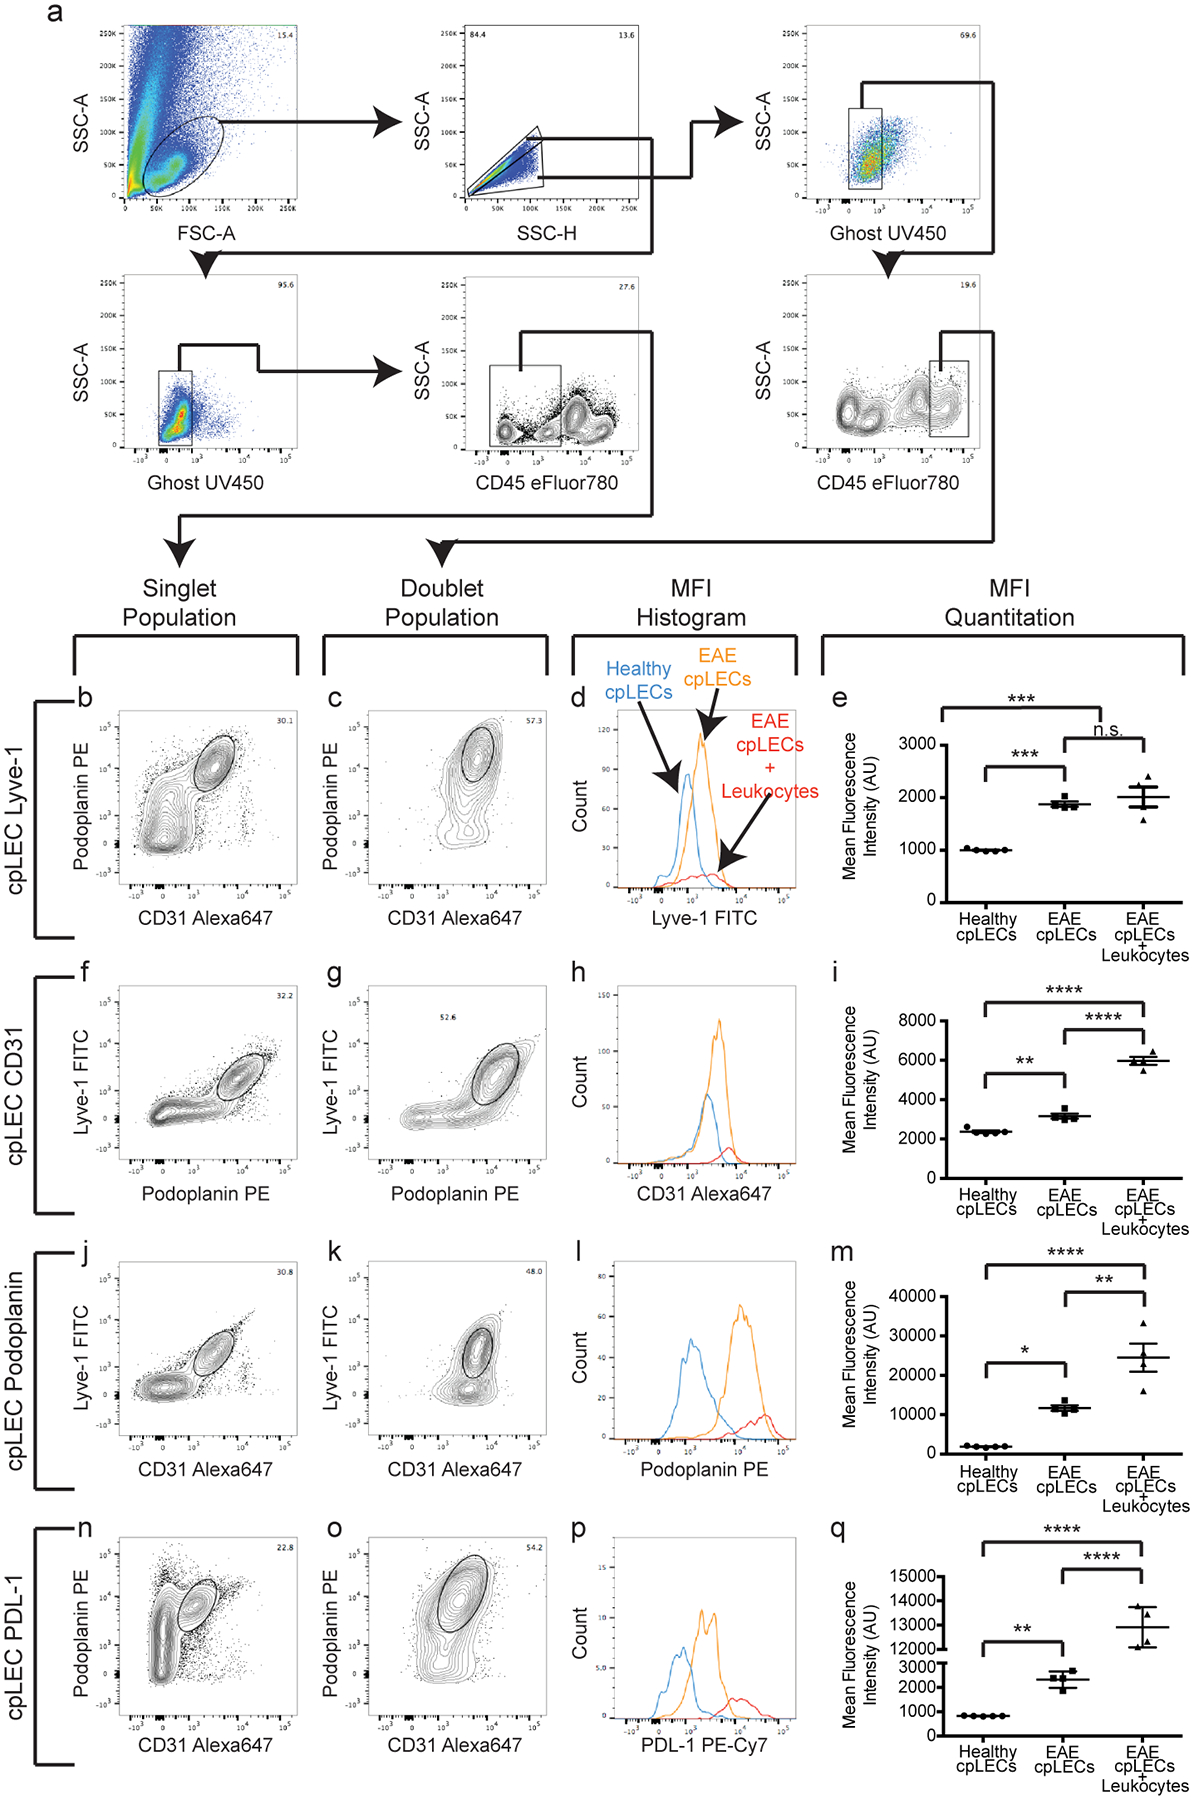
(a): Gating strategy used to confirm the up-regulation of CD31, Podoplanin, Lyve-1, and PDL-1 at the protein level during EAE score 3.0.
(b – q): After gating for cpLECs as either Podoplanin+ CD31+ (b – e, n – q), Podoplanin+ Lyve-1+ (f – i), or Lyve-1+ CD31+ (j – m), the median fluorescence intensity (MFI) of Lyve-1 (b – e), CD31 (f – i), Podoplanin (j – m), and PDL-1 (n – q) by both singlet cpLECs and doublets in which a cpLEC is bound to a CD45+ leukocyte. n = 5 healthy cpLECs, 4 EAE cpLECs, and 4 EAE cpLECs + leukocytes; data are represented as mean ± standard error of the mean. For Lyve-1 MFI, healthy cpLECs vs. EAE cpLECs, p = 0.0003, healthy cpLECs vs. EAE cpLECs + leukocytes, p = 0.0001, EAE cpLECs vs. EAE cpLECs + leukocytes, p = 0.6590; for CD31 MFI, healthy cpLECs vs. EAE cpLECs, p = 0.0043, healthy cpLECs vs. EAE cpLECs + leukocytes, p < 0.0001, EAE cpLECs vs. EAE cpLECs + leukocytes, p < 0.0001; for Podoplanin MFI, healthy cpLECs vs. EAE cpLECs, p = 0.0112, healthy cpLECs vs. EAE cpLECs + leukocytes, p < 0.0001, EAE cpLECs + EAE cpLECs + leukocytes, p = 0.0028; for PD-L1 MFI, healthy cpLECs vs. EAE cpLECs, p = 0.0027, healthy cpLECs vs. EAE cpLECs + leukocytes, p < 0.0001, EAE cpLECs + EAE cpLECs + leukocytes, p < 0.0001; one-way ANOVA using Tukey’s multiple comparisons test.