
Figure 3: cpLECs capture and present CNS-derived antigen.
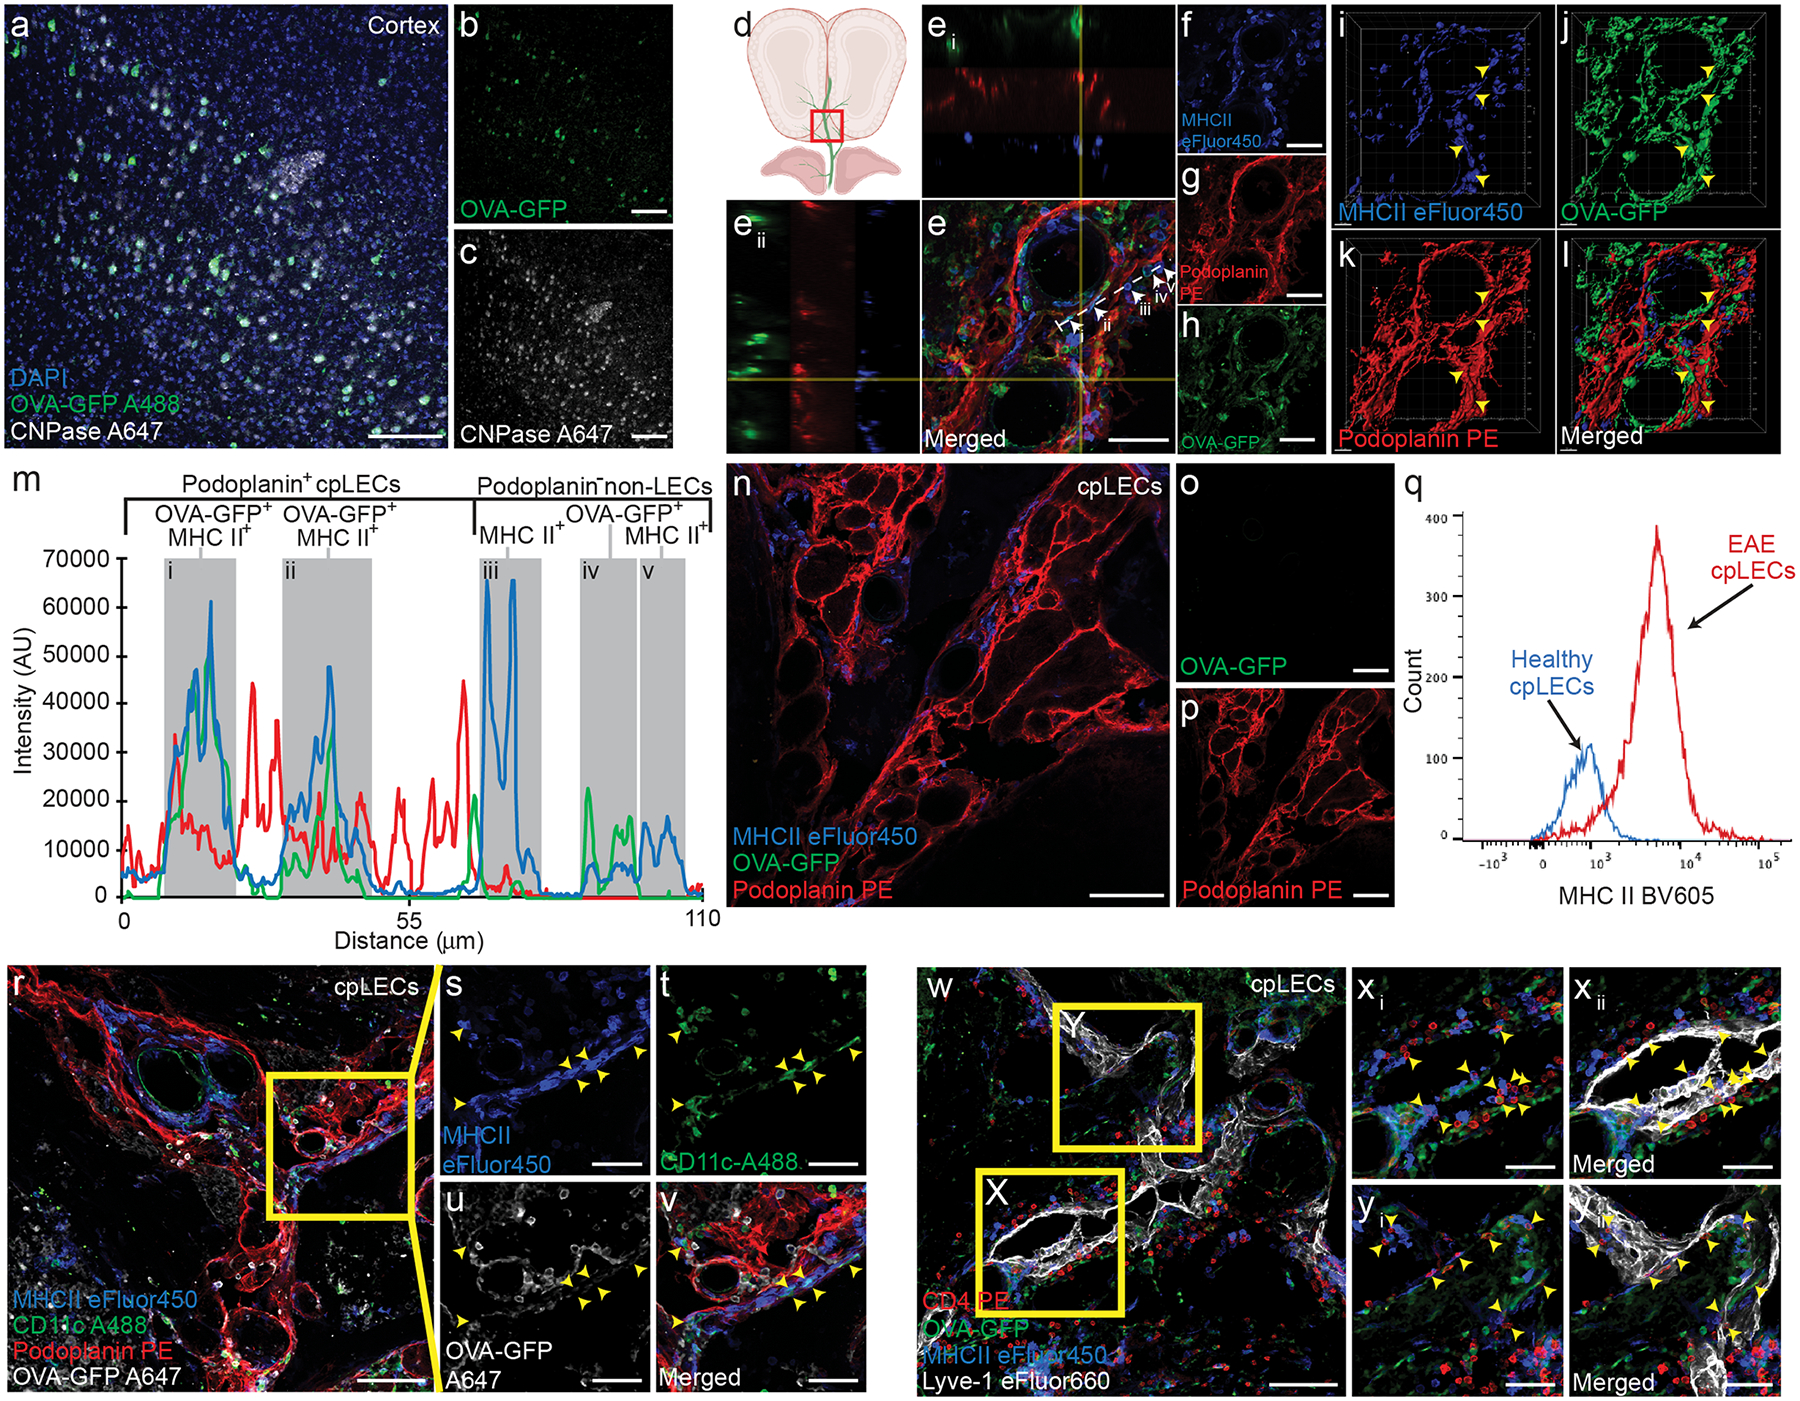
(a – c): EAE was induced in CNP-OVA transgenic mice and analyzed on day 15 post-immunization at score 3.0, in which OVA-GFP+ fl/fl expression is driven by the oligodendrocyte specific CNPase-Cre. Immunohistochemistry of layers V/VI of the cortex confirm OVA-GFP expression by CNPase+ oligodendrocytes within the CNS when immunolabeled with an anti-GFP antibody. Scale bar = 100 μm
(d – h): Immunolabeling of cpLVs confirm MHC II expression and OVA-GFP+ signal by a subset of Podoplanin+ cpLECs. Perpendicular yellow lines highlight two orthogonal views (Ei) and (Eii) along x and y axis indicating colocalization. White dotted line denotes profile intensity of ROI analyzed in (m).
(i – l): 3-D reconstruction of (e – h). Yellow arrowheads indicate MHC II+ OVA-GFP+ cpLECs. Scale bar = 50 μm
(m): Representative plot profile intensity of cells as indicated by the white line shown in (e) showing 5 representative cells, consisting of MHC II+ OVA-GFP+ cpLECs (i and ii), MHC II+ non-cpLECs (iii and v), and MHC II+ OVA-GFP+ non-cpLEC (iv).
(n – p): Control immunolabeling of Podoplanin+ cpLECs with MHCII and without an anti-GFP primary antibody, confirming that there is no unspecific labeling of GFP with the secondary antibody. Scale bar = 100 μm
(q): The median fluorescence intensity histogram of MHCII of cpLECs.
(r – v): Immunolabeling of cpLVs with Podoplanin and dendritic cells near the cribriform plate with CD11c along with MHC II and OVA-GFP. Yellow arrowheads indicate MHC II+ OVA-GFP+ CD11c+ dendritic cells in contact with Podoplanin+ cpLECs. Scale bar = 100 μm (r), 50 μm (s – v)
(w – yii): Immunolabeling of cpLVs with Lyve-1 and CD4+ T cells near the cribriform plate with MHC II and OVA-GFP. Yellow arrowheads indicate CD4+ T cells in contact with MHC II+ OVA-GFP+ Lyve-1+ cpLECs. Scale bar = 100 μm (w), 50 μm (xi – yii)