
Figure 4: Inflamed cpLECs activate naïve 2D2 T cells.
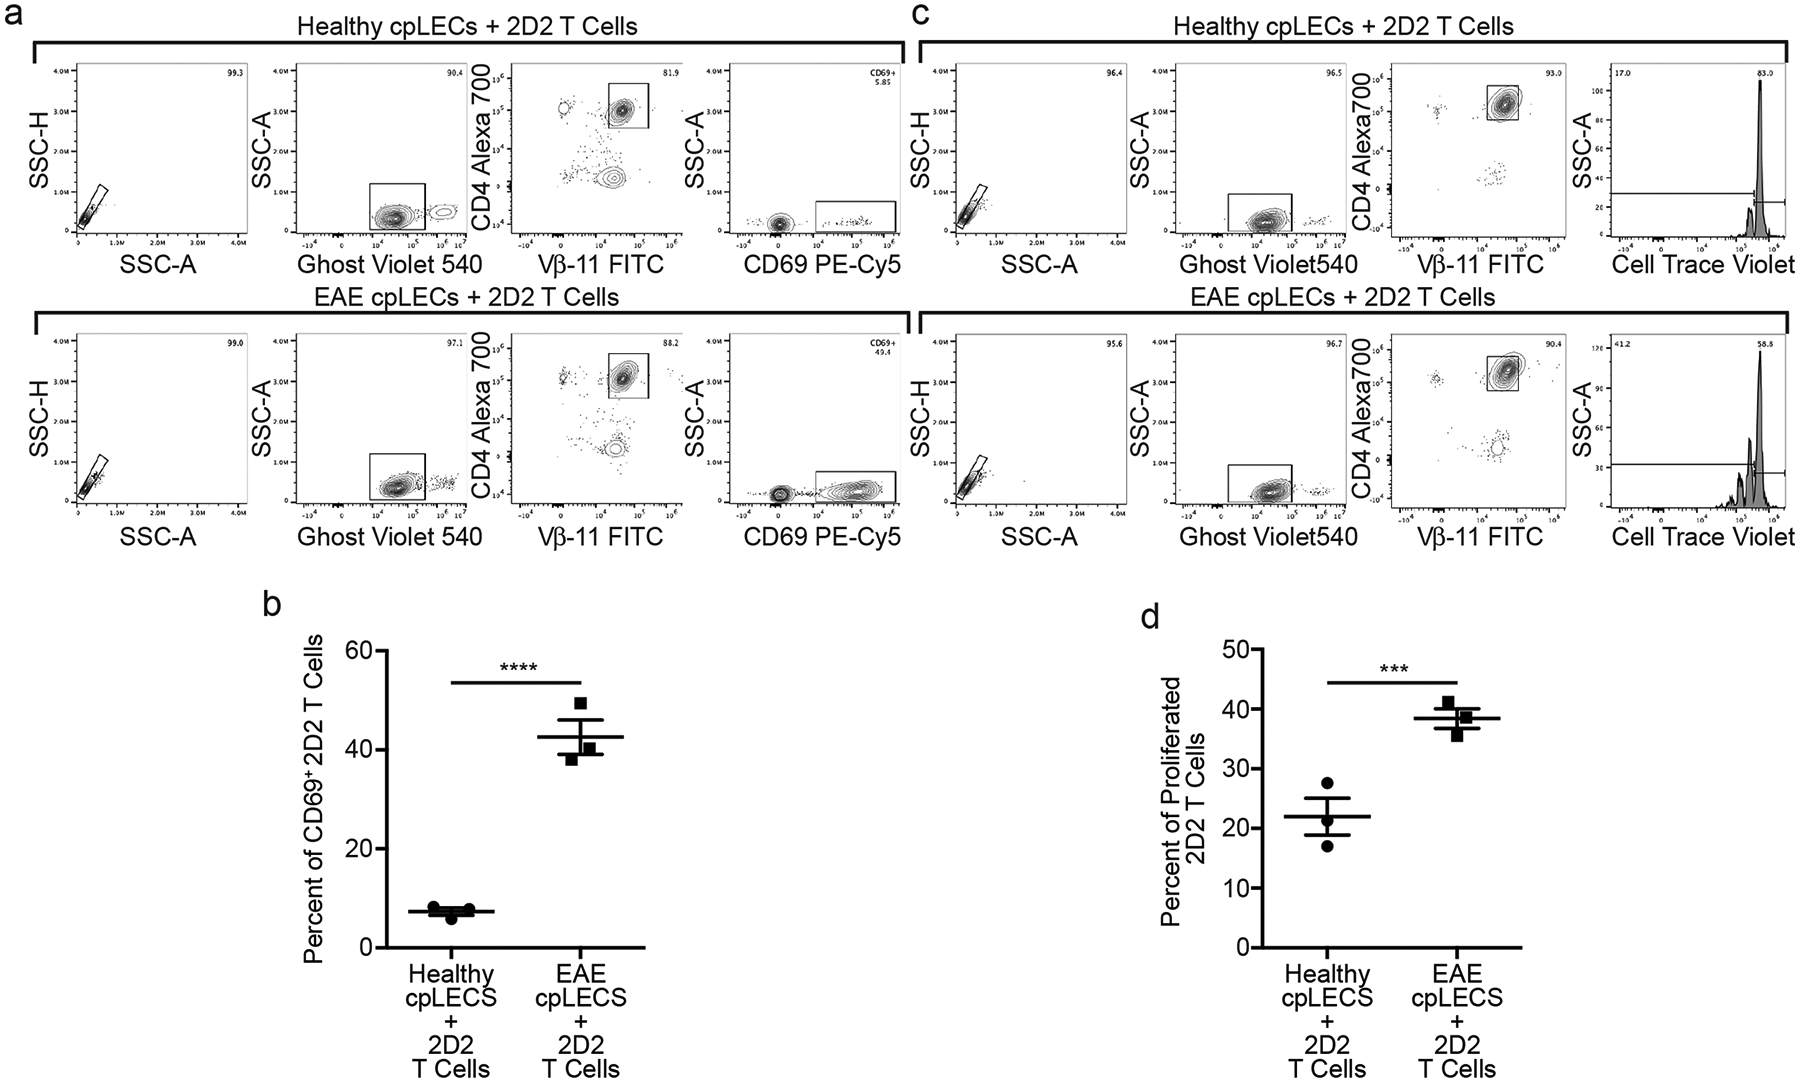
(a – b): Gating strategy for cpLECs collected from EAE and healthy control mice were co-cultured for 24 h with 2D2 T-cells. (a). Quantification of percent of activated (CD69+) 2D2 T-cells after 24 h of co-culture (b). n = 3 experimental replicates, pooled from 4 healthy and 4 EAE mice; data are represented as mean ± standard error of the mean. p = 0.0006; unpaired Student’s t-test.
(c – d): Gating strategy for cpLECs collected from EAE and healthy control mice were co-cultured for 72 h with 2D2 T-cells. (c). Quantification of percent of proliferated (CellTrace Violet) 2D2 T-cells after 72 h of co-culture (d). n = 3 experimental replicates, pooled from 4 healthy and 4 EAE mice; data are represented as mean ± standard error of the mean. p = 0.0092; unpaired Student’s t-test.