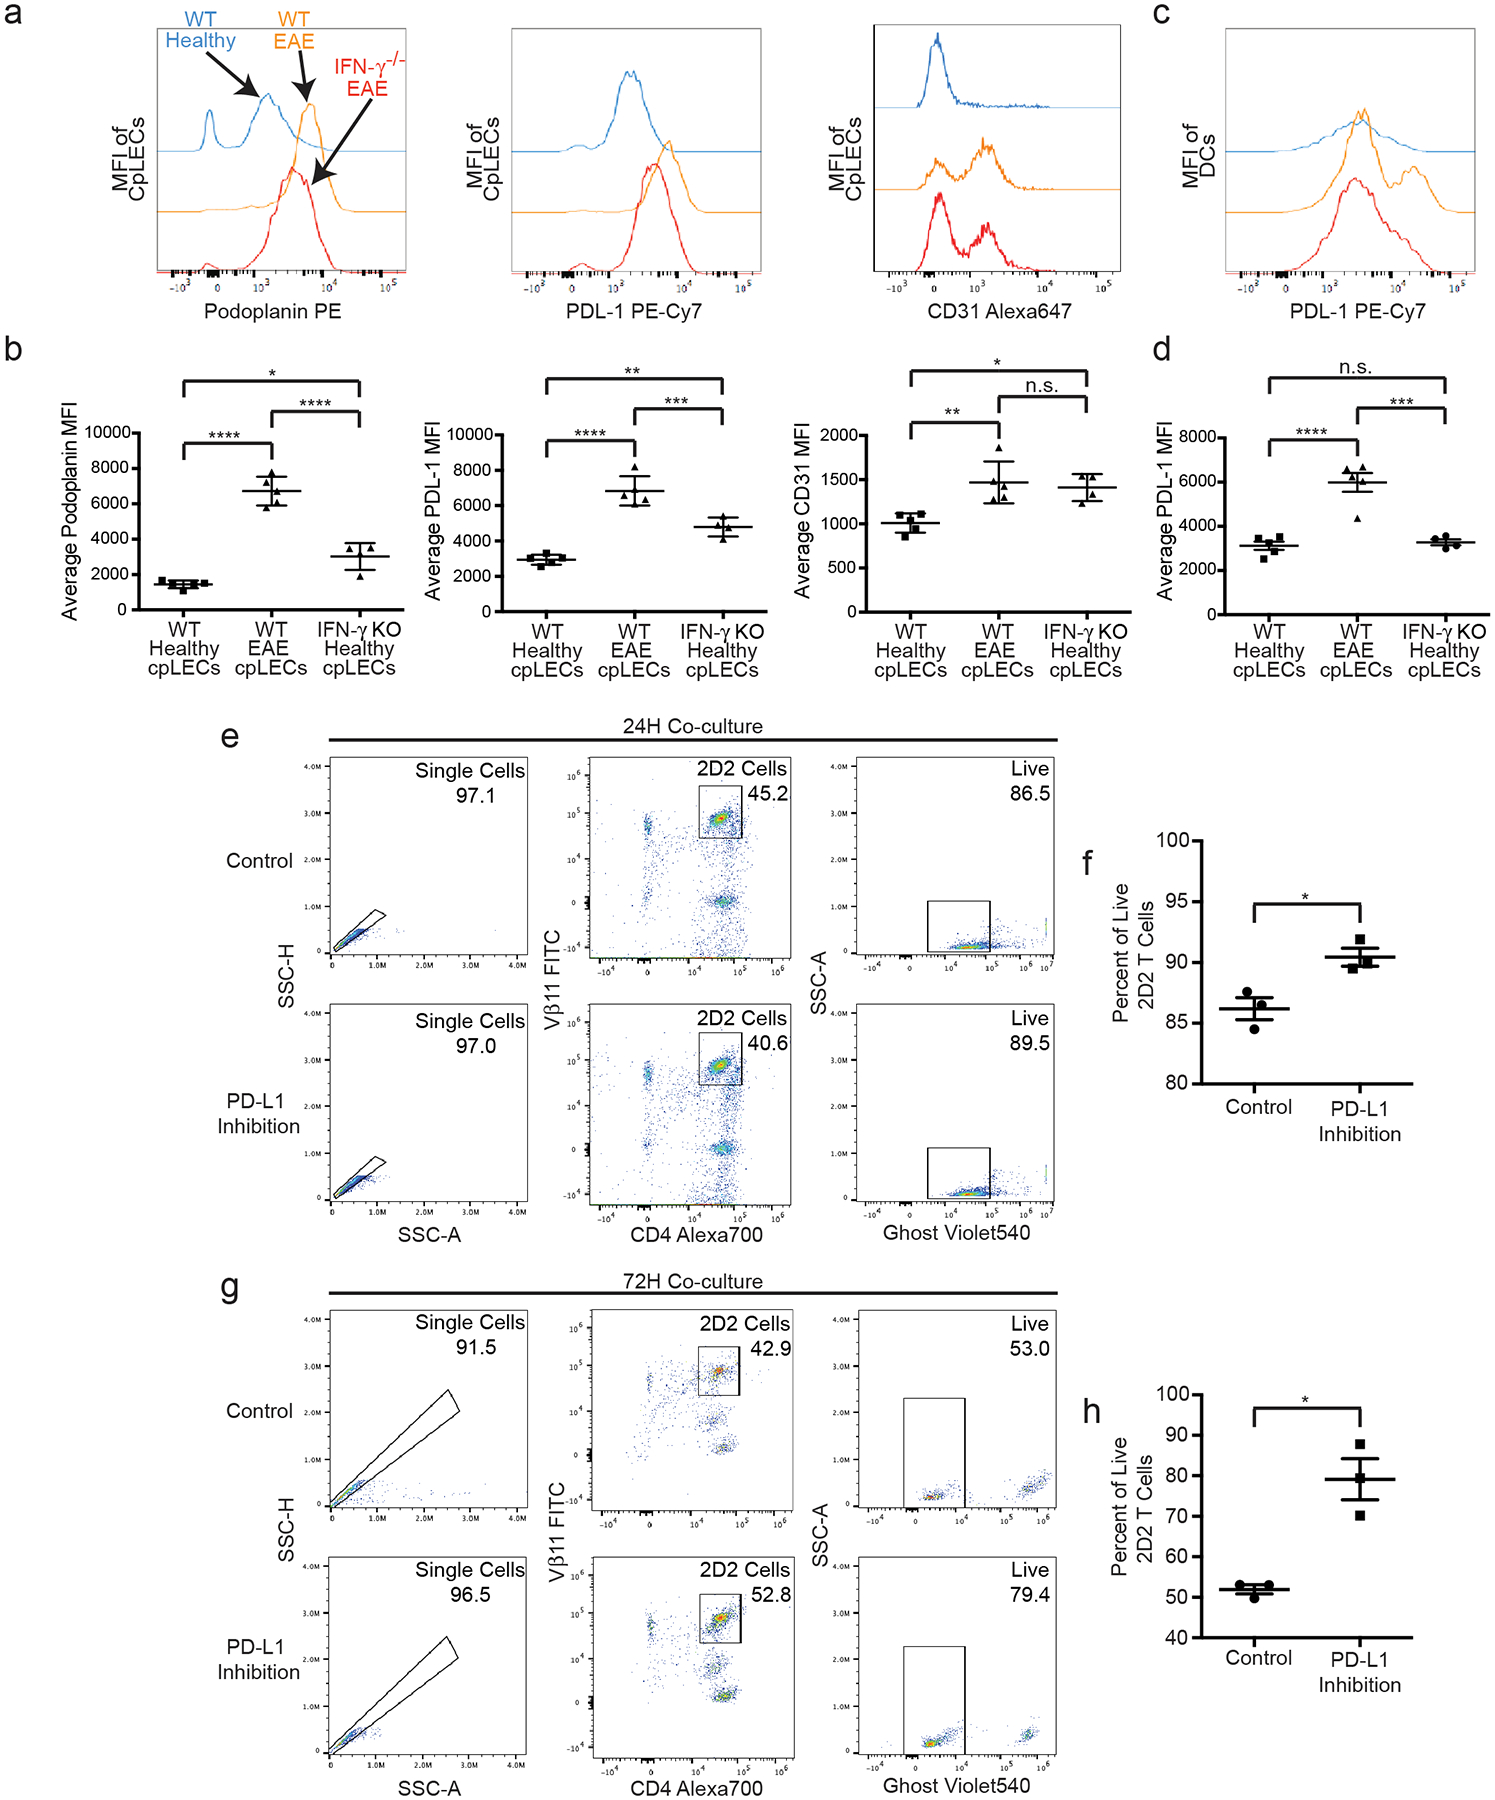
Figure 5: Upregulation of Podoplanin and PD-L1 is mediated by IFN-γ.

(a – b): The median fluorescence intensity and quantitation of Podoplanin, PD-L1, and CD31 in cpLEC of wild-type and IFN-γ−/− C57BL/6J mice. n = 5 wild-type healthy mice, 5 wild-type EAE mice, 4 IFN-γ−/− EAE mice; data are represented as mean ± standard error of the mean. For Podoplanin MFI, wild-type healthy vs. wild-type EAE, p < 0.0001; wild-type healthy vs. IFN-γ−/− EAE, p = 0.0101; wild-type EAE vs. IFN-γ−/− EAE, p < 0.0001. For PD-L1 MFI, wild-type healthy vs. wild-type EAE, p < 0.0001; wild-type healthy vs. IFN-γ−/− EAE, p = 0.0020; wild-type EAE vs. IFN-γ−/− EAE, p = 0.0010. For CD31 MFI, wild-type healthy vs. wild-type EAE, p = 0.0043; wild-type healthy vs. IFN-γ−/− EAE, p < 0.0001; wild-type EAE vs. IFN-γ−/− EAE, p < 0.0001; one-way ANOVA with Tukey’s post-hoc multiple comparisons test.
(c – d): The median fluorescence intensity and quantitation of PD-L1 in dendritic cells of wild-type and IFN-γ−/− C57BL/6J mice. n = 5 wild-type healthy mice, 5 wild-type EAE mice, 4 IFN-γ−/− EAE mice; data are represented as mean ± standard error of the mean. For PD-L1 MFI, wild-type healthy vs. wild-type EAE, p < 0.0001; wild-type healthy vs. IFN-γ−/− EAE, p = 0.9314; wild-type EAE vs. IFN-γ−/− EAE, p < 0.0002; one-way ANOVA with Tukey’s post-hoc multiple comparisons test.
(e – f): Gating strategy for cpLECs collected from EAE mice were co-cultured for 24 h with 2D2 T-cells and treated with either a PD-L1 inhibitor or PBS control (e). Quantification of percent live (Ghost−) 2D2 T-cells after 24 h of co-culture (f). n = 3 experimental replicates, pooled from 4 healthy and 4 EAE mice; data are represented as mean ± standard error of the mean. Control vs. PD-L1 inhibition, p = 0.0225; unpaired Student’s t-test.
(g – h): Gating strategy for cpLECs collected from EAE mice were co-cultured for 72 h with 2D2 T-cells with either a PD-L1 inhibitor or PBS control (g). Quantification of percent live (Ghost−) 2D2 T-cells after 24 h of co-culture (h). n = 3 experimental replicates, pooled from 4 healthy and 4 EAE mice; data are represented as mean ± standard error of the mean. Control vs. PD-L1 inhibition, p = 0.0064; unpaired Student’s t-test.
