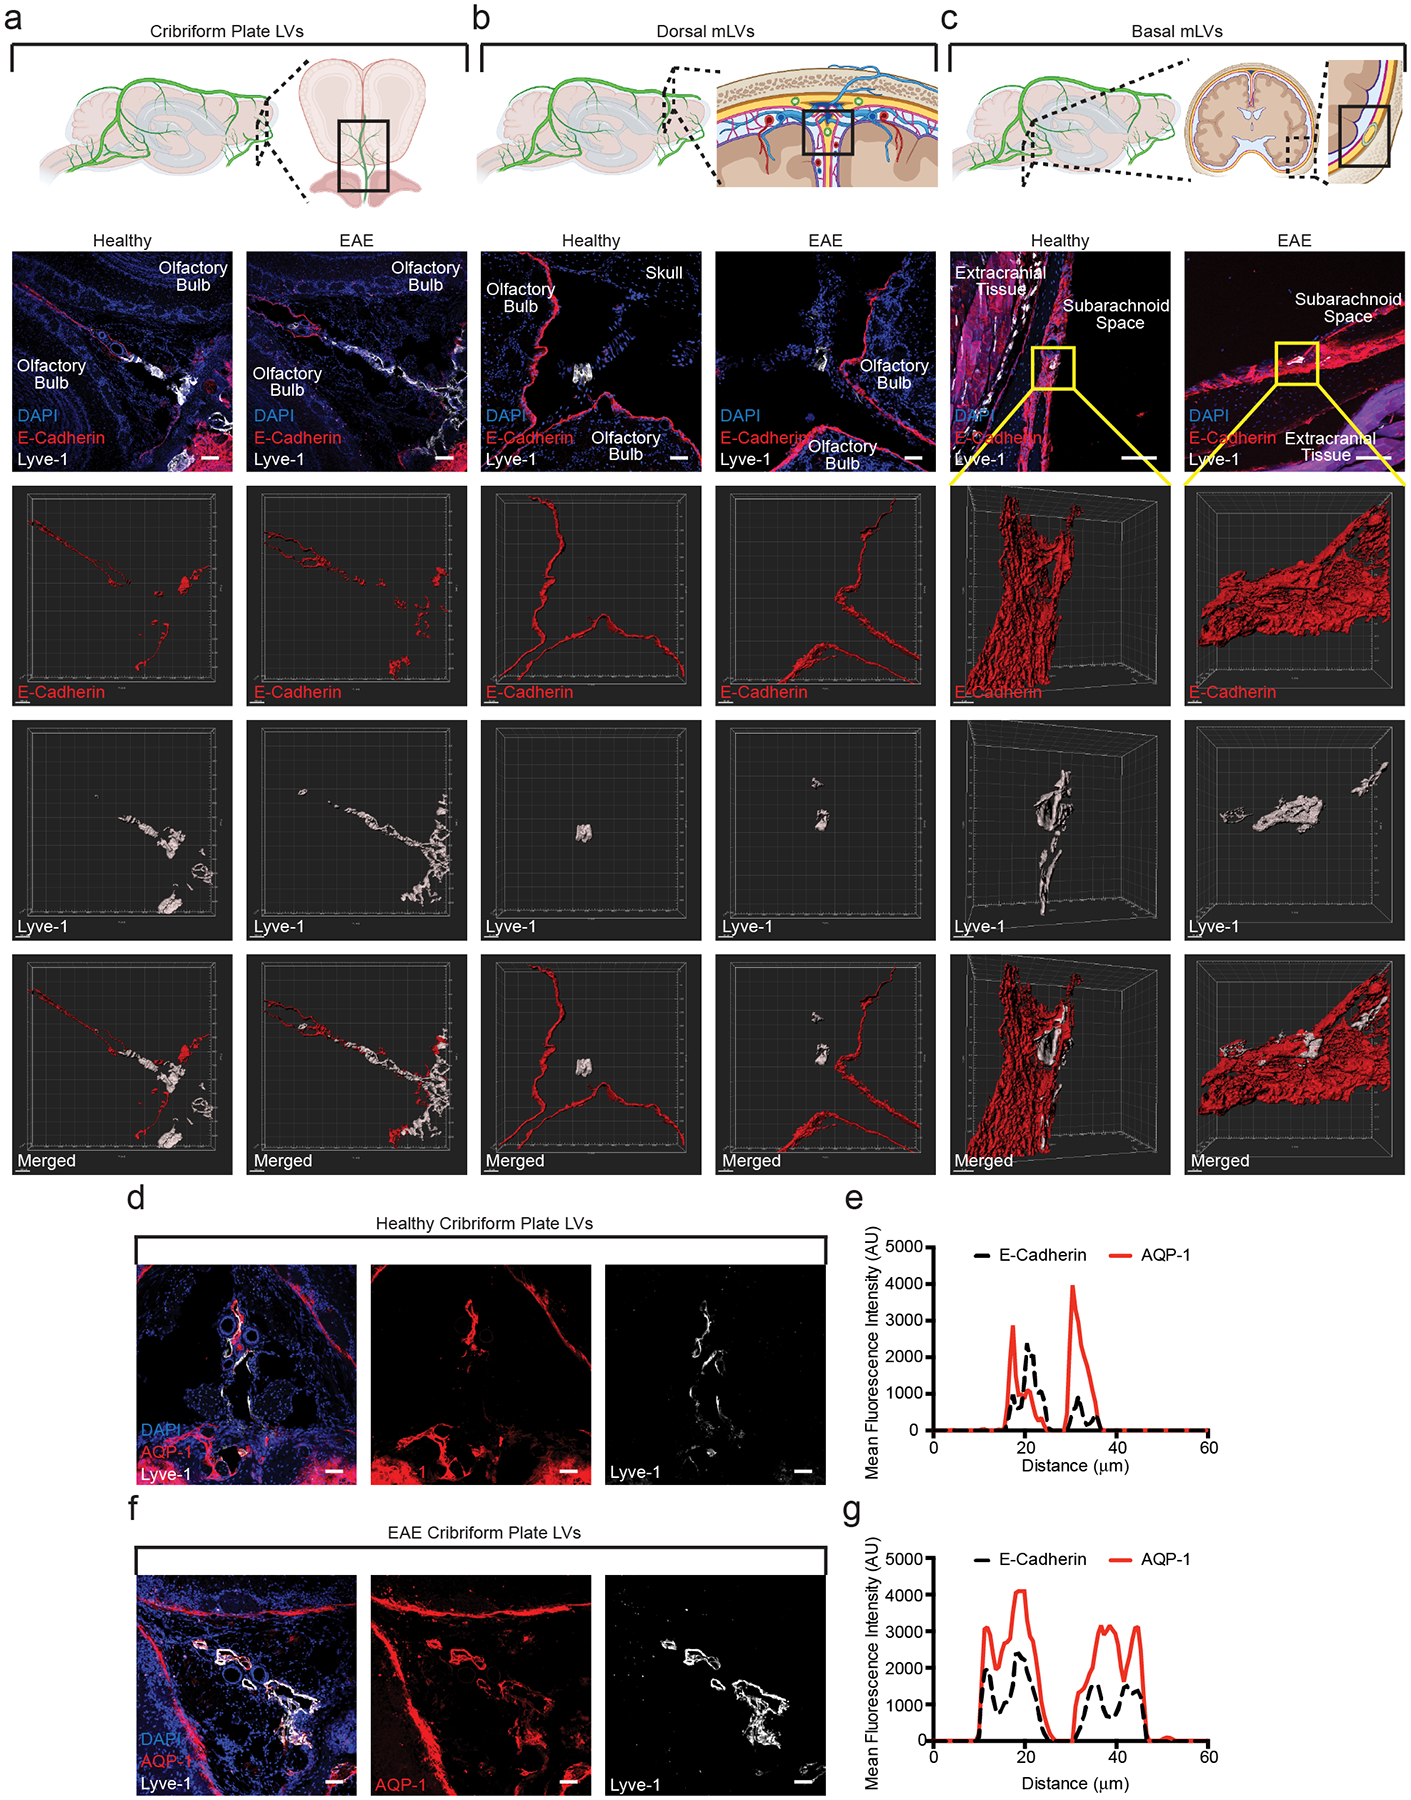
Figure 6: cpLECs are in a prime position to access CSF.

(a – c): Immunolabeling of the cribriform plate (a), dura above the olfactory bulbs (b), and basal meninges below the brain (c). Top row: Schematics outlining where each of the confocal images are taken. All sections are coronal sections of the whole head. Second row: merged immunohistochemistry images labeled with DAPI to visualize nuclei, E-Cadherin for the epithelial cells that comprise the arachnoid barrier, and Lyve-1 for lymphatic vessels. Third row: 3D surface rendering of the E-Cadherin+ arachnoid barrier. Fourth row: 3D surface rendering of the Lyve-1+ lymphatic vessels. Fifth row: 3D surface rendering of both the E-Cadherin+ arachnoid barrier and Lyve-1+ lymphatic vessels together. EAE sections are taken at day 15 post-immunization at EAE score 3.0. Scale bar = 50 μm
(d – g): Immunolabeling of the cribriform plate from either healthy (d) or EAE (f) for the water channel AQP-1 and Lyve-1. Scale bar = 50 μm. Representative plot profile intensity analysis confirms co-localization of AQP-1 expression with Lyve-1+ lymphatic vessels in both healthy (e) and EAE (g). EAE sections are taken at day 15 post-immunization at EAE score 3.0.
