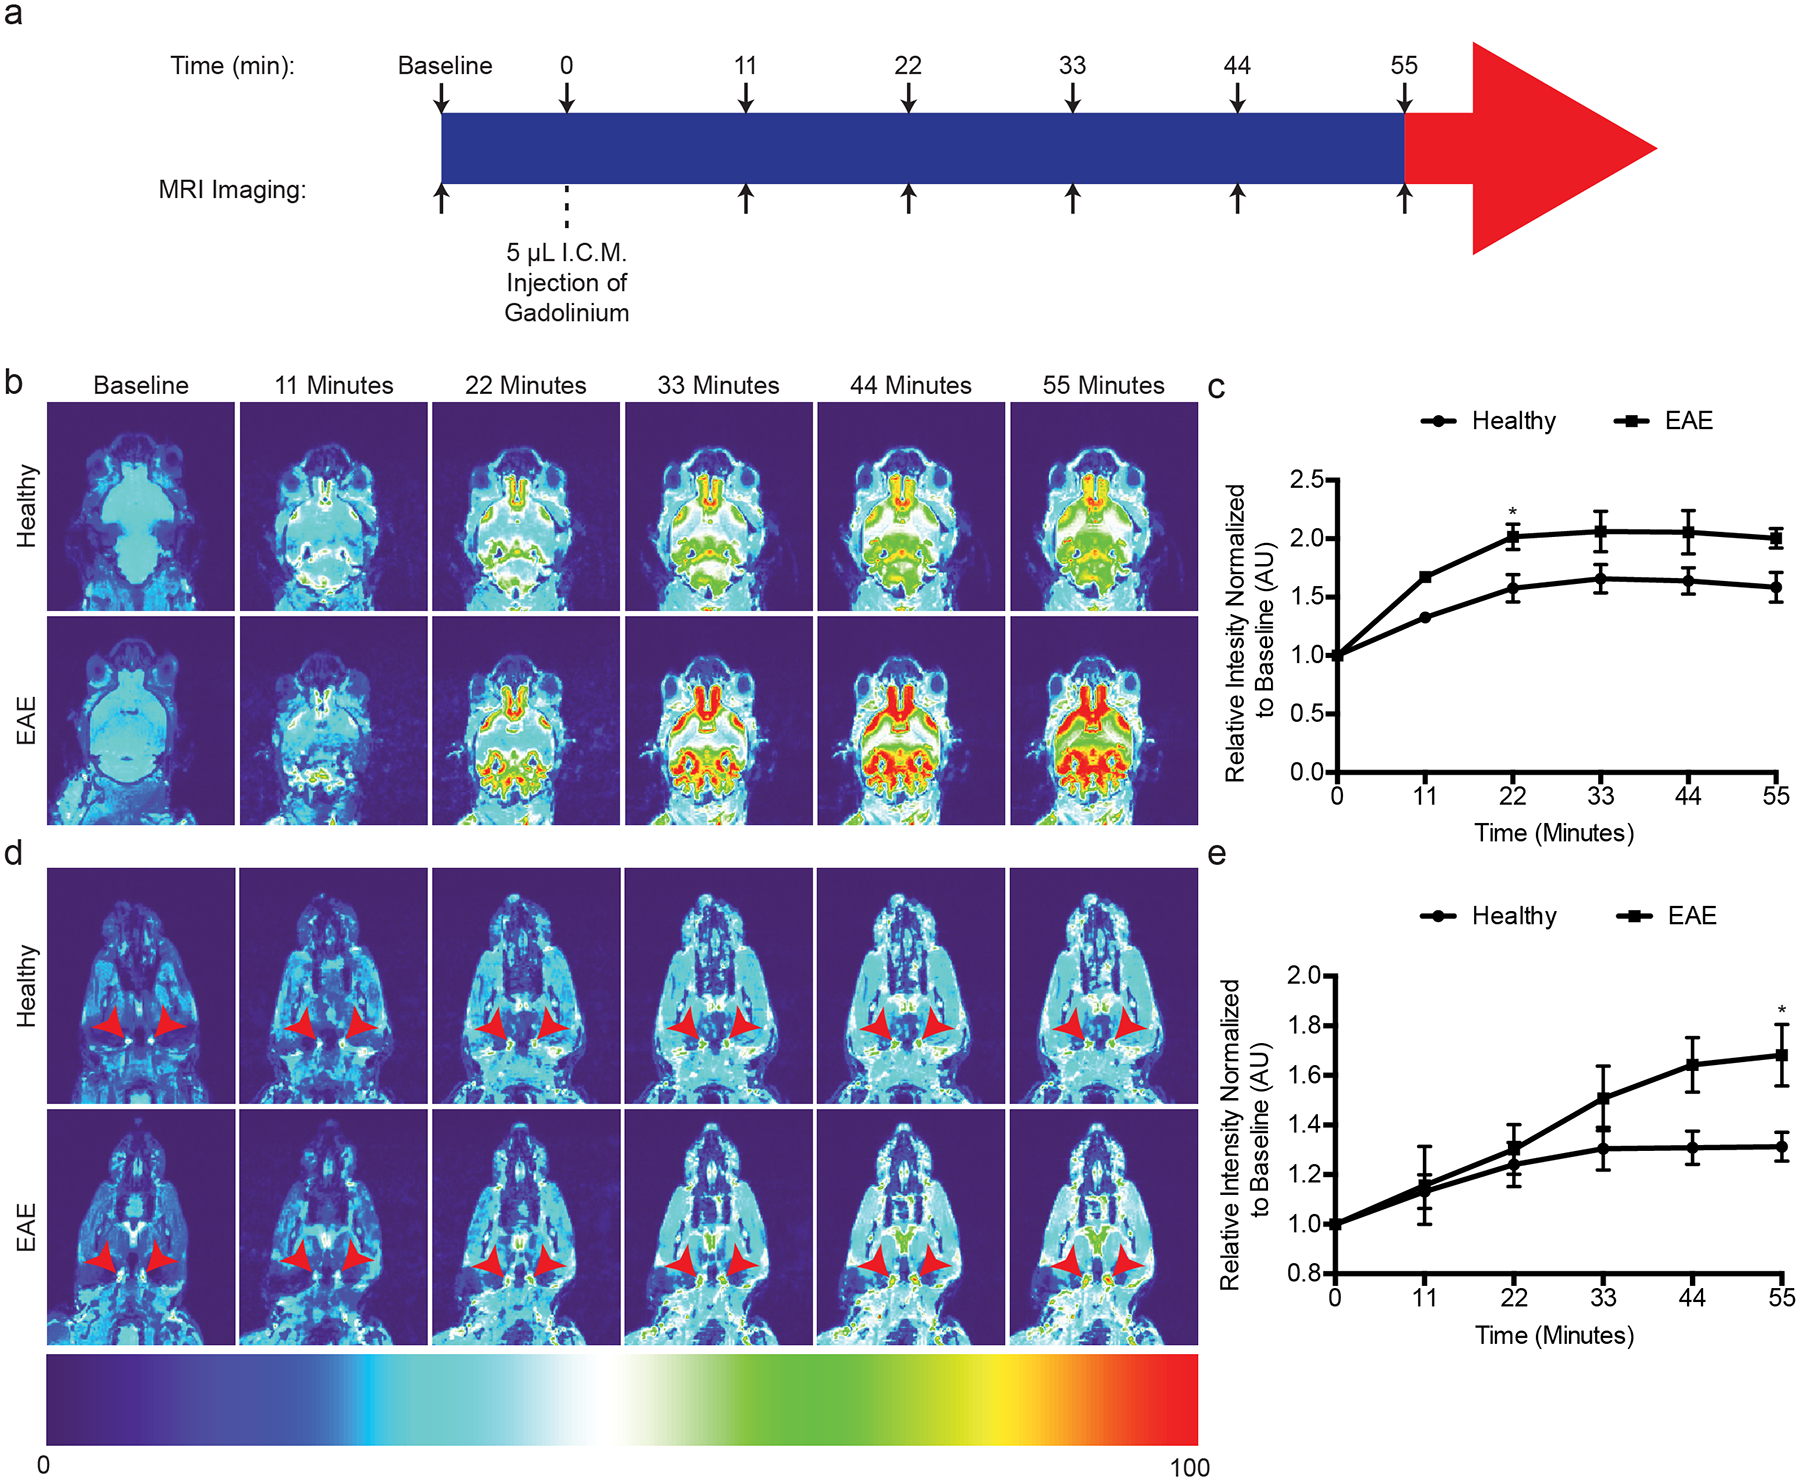
Figure 7: cpLECs have direct access to the subarachnoid space.

(a): Schematic of experimental design.
(b): Representative T1-weighted scans of the base of the brain and olfactory bulbs where the basal mLVs and cpLVs reside at baseline before Gadolinium infusion, and serial T1-weighted scans after Gadolinium infusion. Representative serial MRI images comparing healthy and EAE score 3.0 are shown. Note the accumulation of Gadolinium signal between the olfactory bulbs and base of the brain.
(c): Quantitation of the average pixel intensity where cpLVs reside, ventral medially to the olfactory bulbs normalized to baseline between healthy and EAE. n = 5 healthy mice, 4 EAE mice; data are represented as mean ± standard error of the mean. For healthy vs. EAE, t = 0 min, p > 0.9999; t = 11 min, p = 0.1707; t = 22 min, p = 0.0398; t = 33 min, p = 0.0707; t = 44 min, p = 0.0568 min; t = 55 min, p = 0.0567; two-way ANOVA using Sidaks multiple comparisons test.
(d): Representative scans of the neck showing the dCLNs as indicated by the red arrowheads comparing healthy and EAE score 3.0.
(e): Quantitation of the average pixel intensity of the dCLNs as indicated by the red arrowheads in (d) normalized to baseline between healthy and EAE. n = 5 healthy mice, 4 EAE mice; data are represented as mean ± standard error of the mean. For healthy vs. EAE, t = 0 min, p > 0.9999; t = 11 min, p > 0.9999; t = 22 min, p = 0.9976; t = 33 min, p = 0.5281; t = 44 min, p = 0.0694 min; t = 55 min, p = 0.0350; two-way ANOVA using Sidaks multiple comparisons test.
