
Extended Data Fig. 1. Characterization of cribriform plate cell suspension.
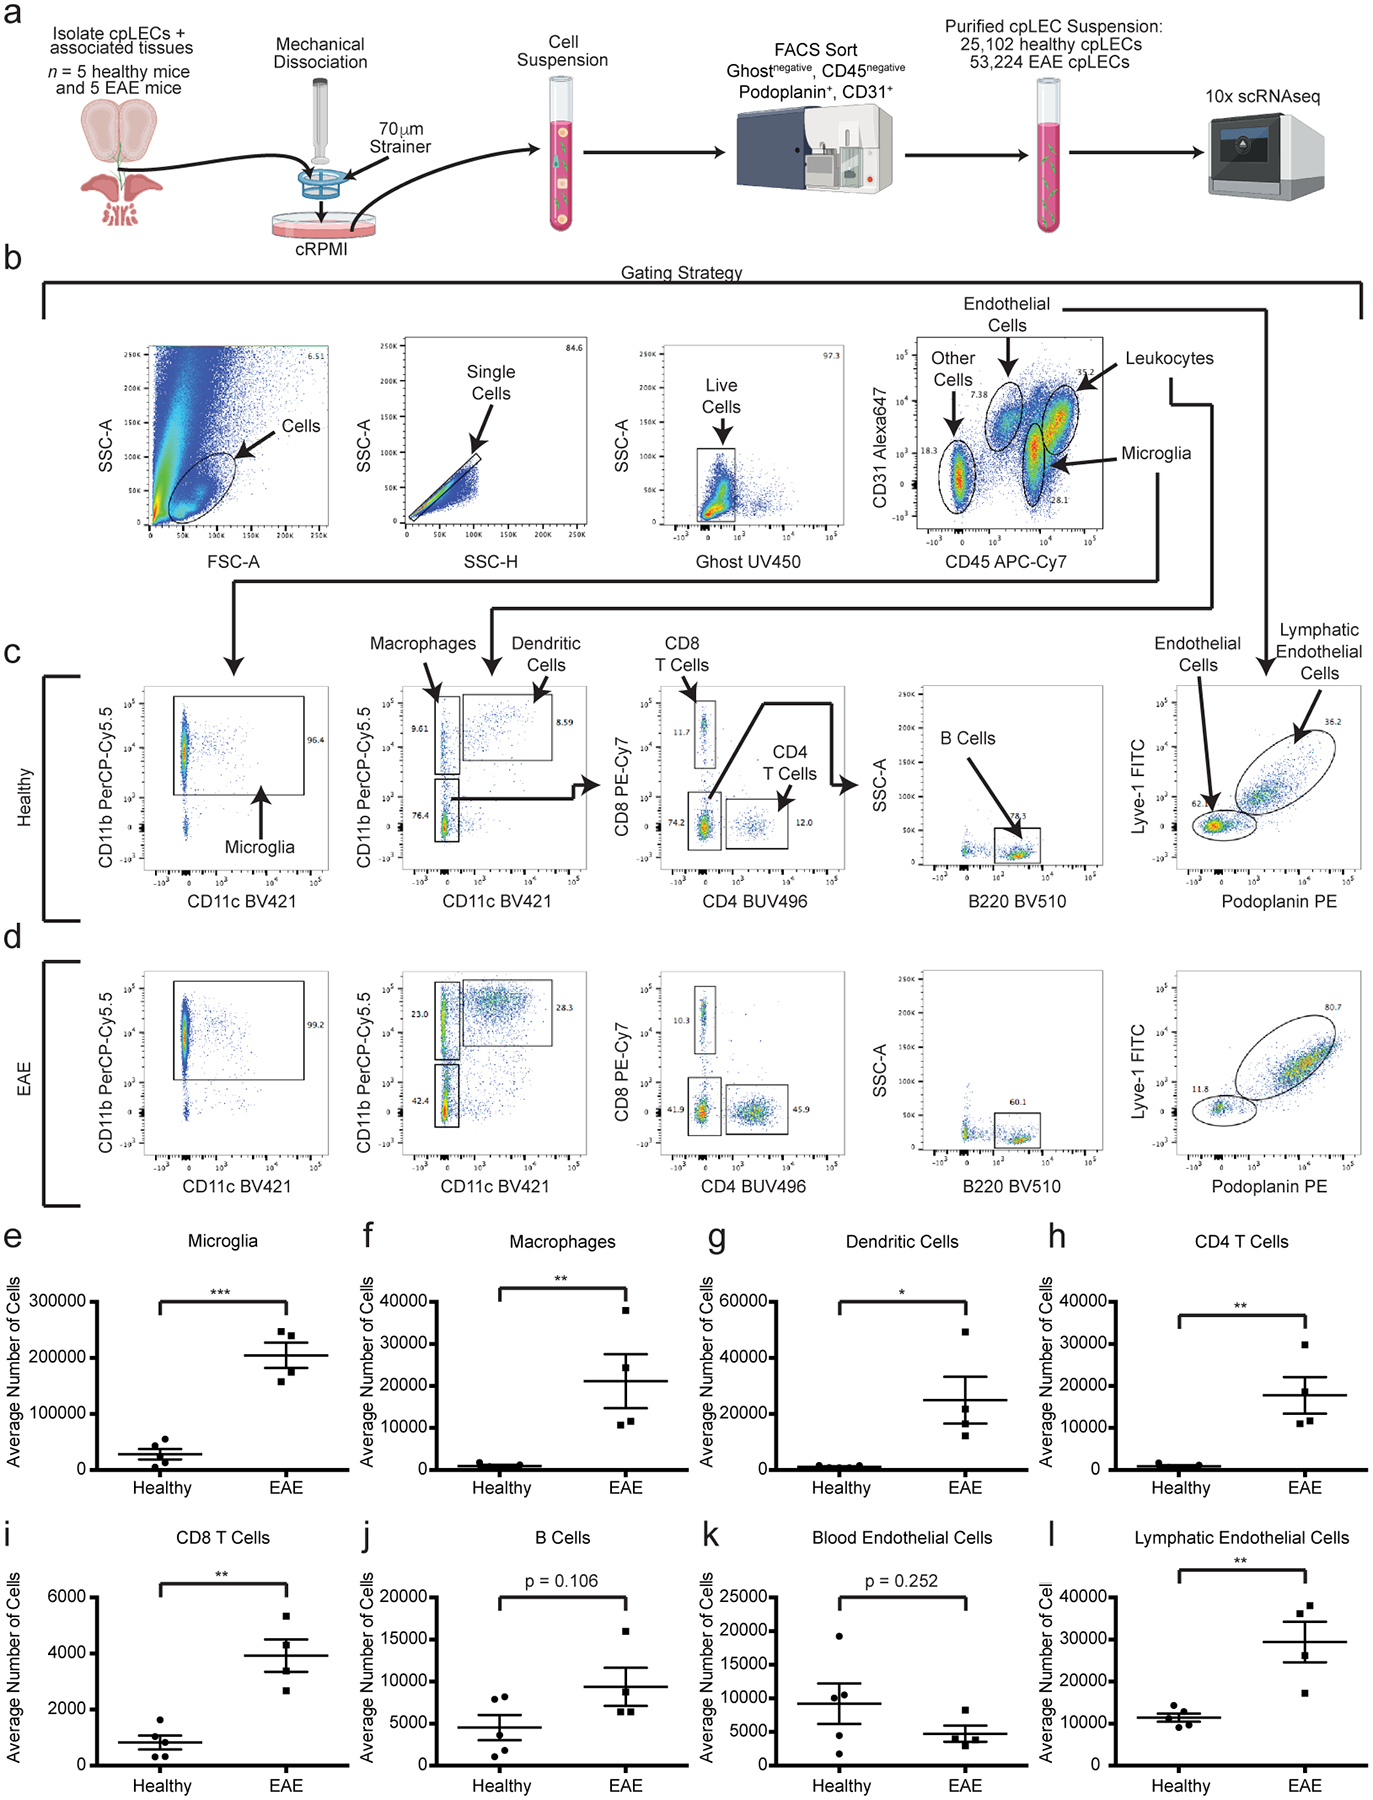
(a): Experimental design for generating a single cell suspension of the cribriform plate.
(b – d): Gating strategy used to identify cell types from the cpLEC cell suspension between healthy (c) and EAE score 3.0 (d). Microglia are identified as CD45intermediate CD11b+, macrophages as CD45+ CD11b+ CD11c−, dendritic cells as CD45+ CD11b+ CD11c+, CD4 T cells as CD45+ CD11b− CD11c− CD4+, CD8 T cells as CD45+ CD11b− CD11c− CD8+, B cells as CD45+ CD11b− CD11c− CD4− CD8− B220+, blood endothelial cells as CD45low CD31+ Lyve-1− Podoplanin−, and lymphatic endothelial cells as CD45low CD31+ Lyve-1+ Podoplanin+.
(e – l): Quantitation of the average cell numbers of microglia (e), macrophages (f), dendritic cells (g), CD4 T cells (h), CD8 T cells (i), B cells (j), blood endothelial cells (k), and lymphatic endothelial cells (l) between healthy and EAE score 3.0. n = 5 healthy mice, 4 EAE mice; data are represented as mean ± standard error of the mean. For microglia, p = 0.0001; for macrophages, p = 0.0091; for dendritic cells, p = 0.0141; for CD4 T cells, p = 0.0031; for CD8 T cells, p = 0.0011; for B cells, p = 0.1059; for blood endothelial cells, p = 0.2523; for lymphatic endothelial cells, p = 0.0045; unpaired Student’s t-test.