
Extended Data Fig. 2. Volcano and CNET plots of scRNAseq.
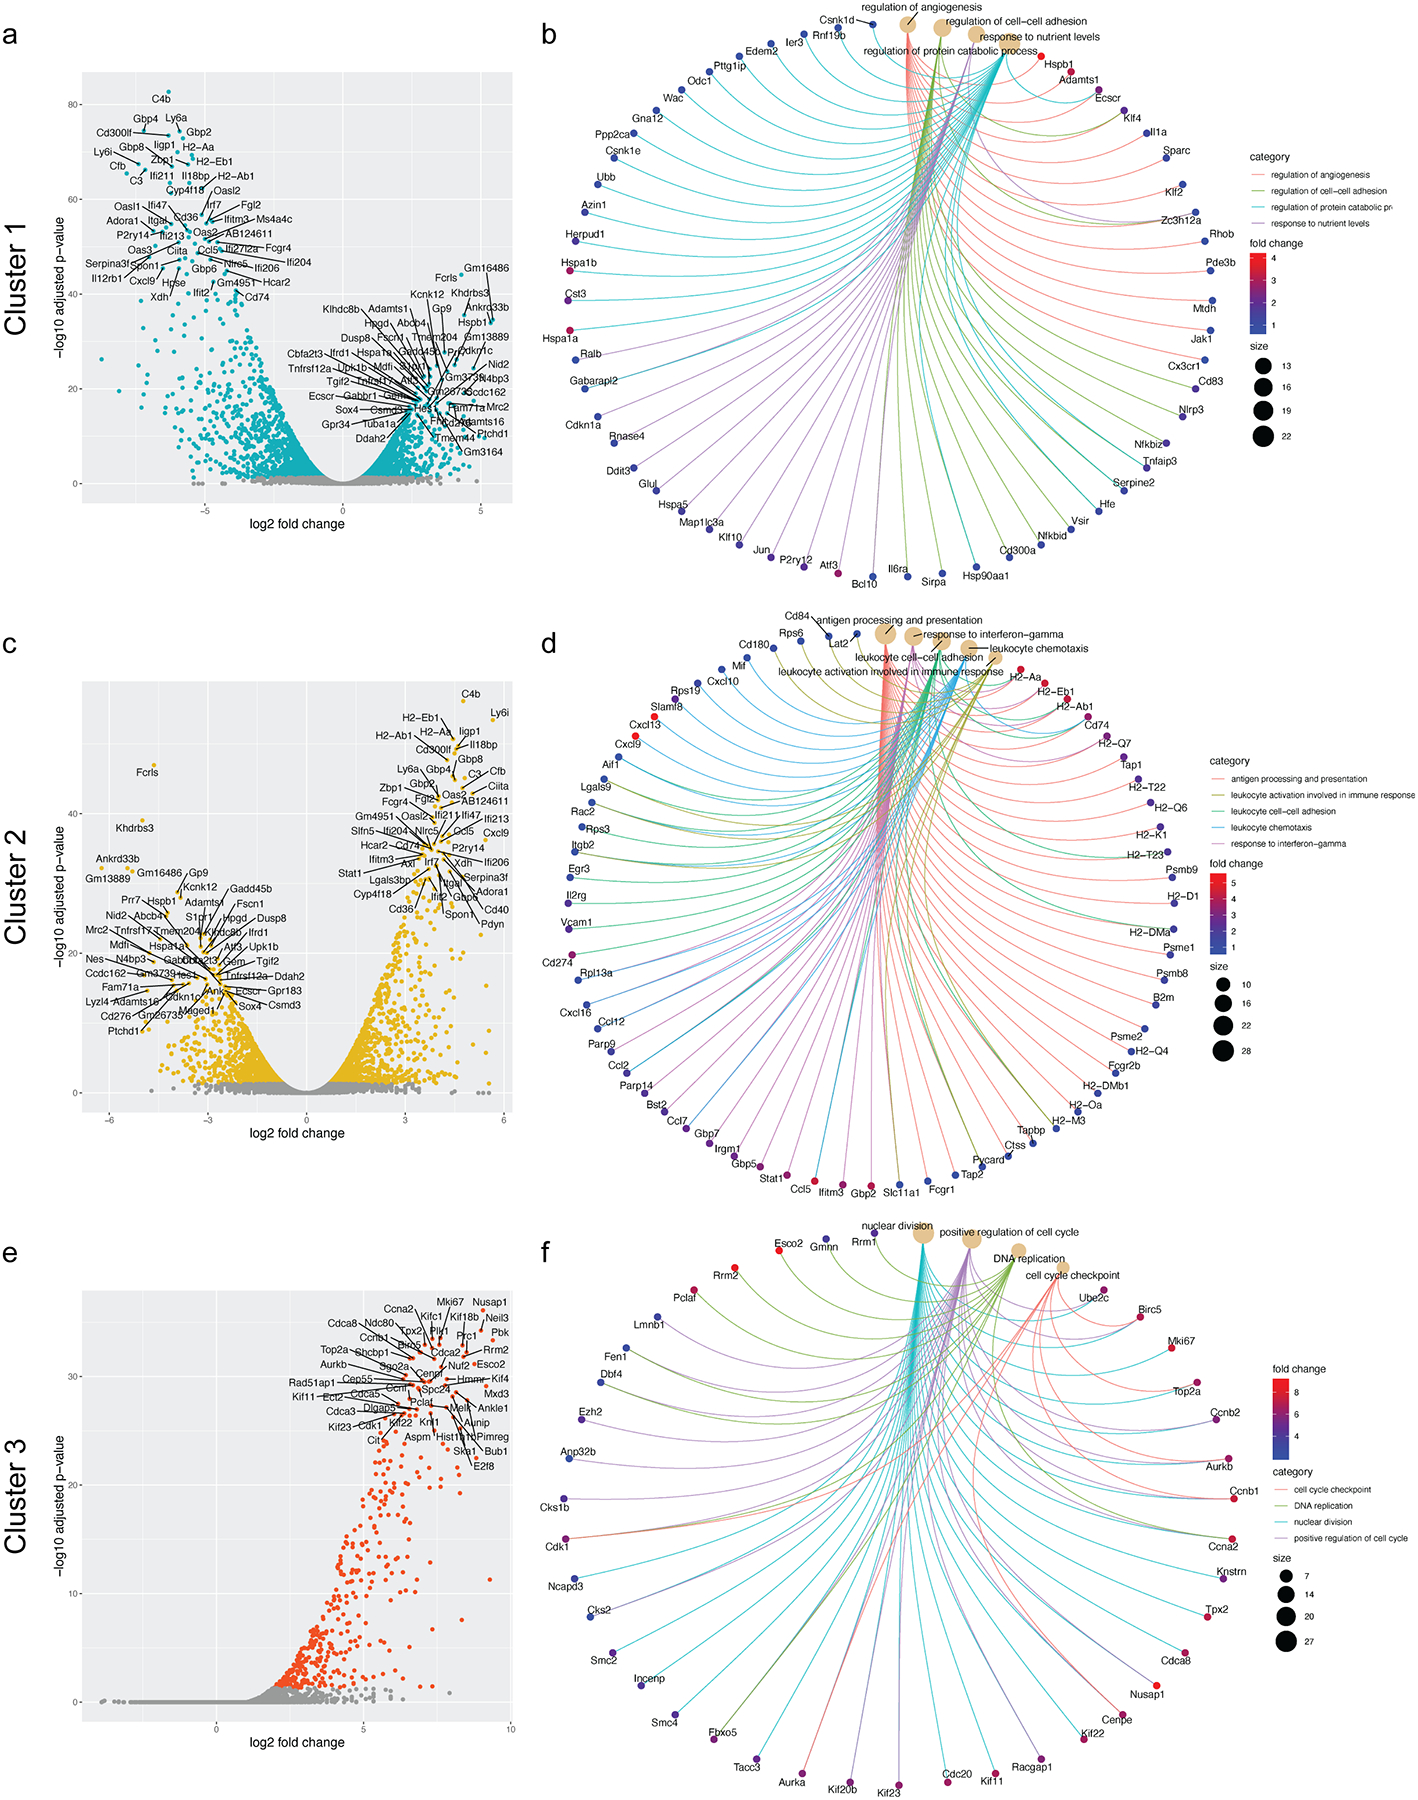
(a): Volcano plot showing the top 50 most up-regulated and down-regulated genes in Cluster 1.
(b): Cnet plot detailing the strength of association between representative GO enrichment terms for Cluster 1 for regulation of angiogenesis, regulation of protein catabolic process, regulation of cell-cell adhesion, and response to nutrient levels along with their associated genes.
(c): Volcano plot showing the top 50 most up-regulated and down-regulated genes in Cluster 2.
(d): Cnet plot detailing the strength of association between representative GO enrichment terms for Cluster 2 for antigen processing and presentation, response to interferon-gamma, leukocyte cell-cell adhesion, leukocyte chemotaxis, and leukocyte activation involved in immune response along with their associated genes.
(e): Volcano plot showing the top 50 most up-regulated genes in Cluster 3.
(f): Cnet plot detailing the strength of association between representative GO enrichment terms for Cluster 3 for nuclear division, positive regulation of cell cycle, DNA replication, and cell cycle checkpoint along with their associated genes.