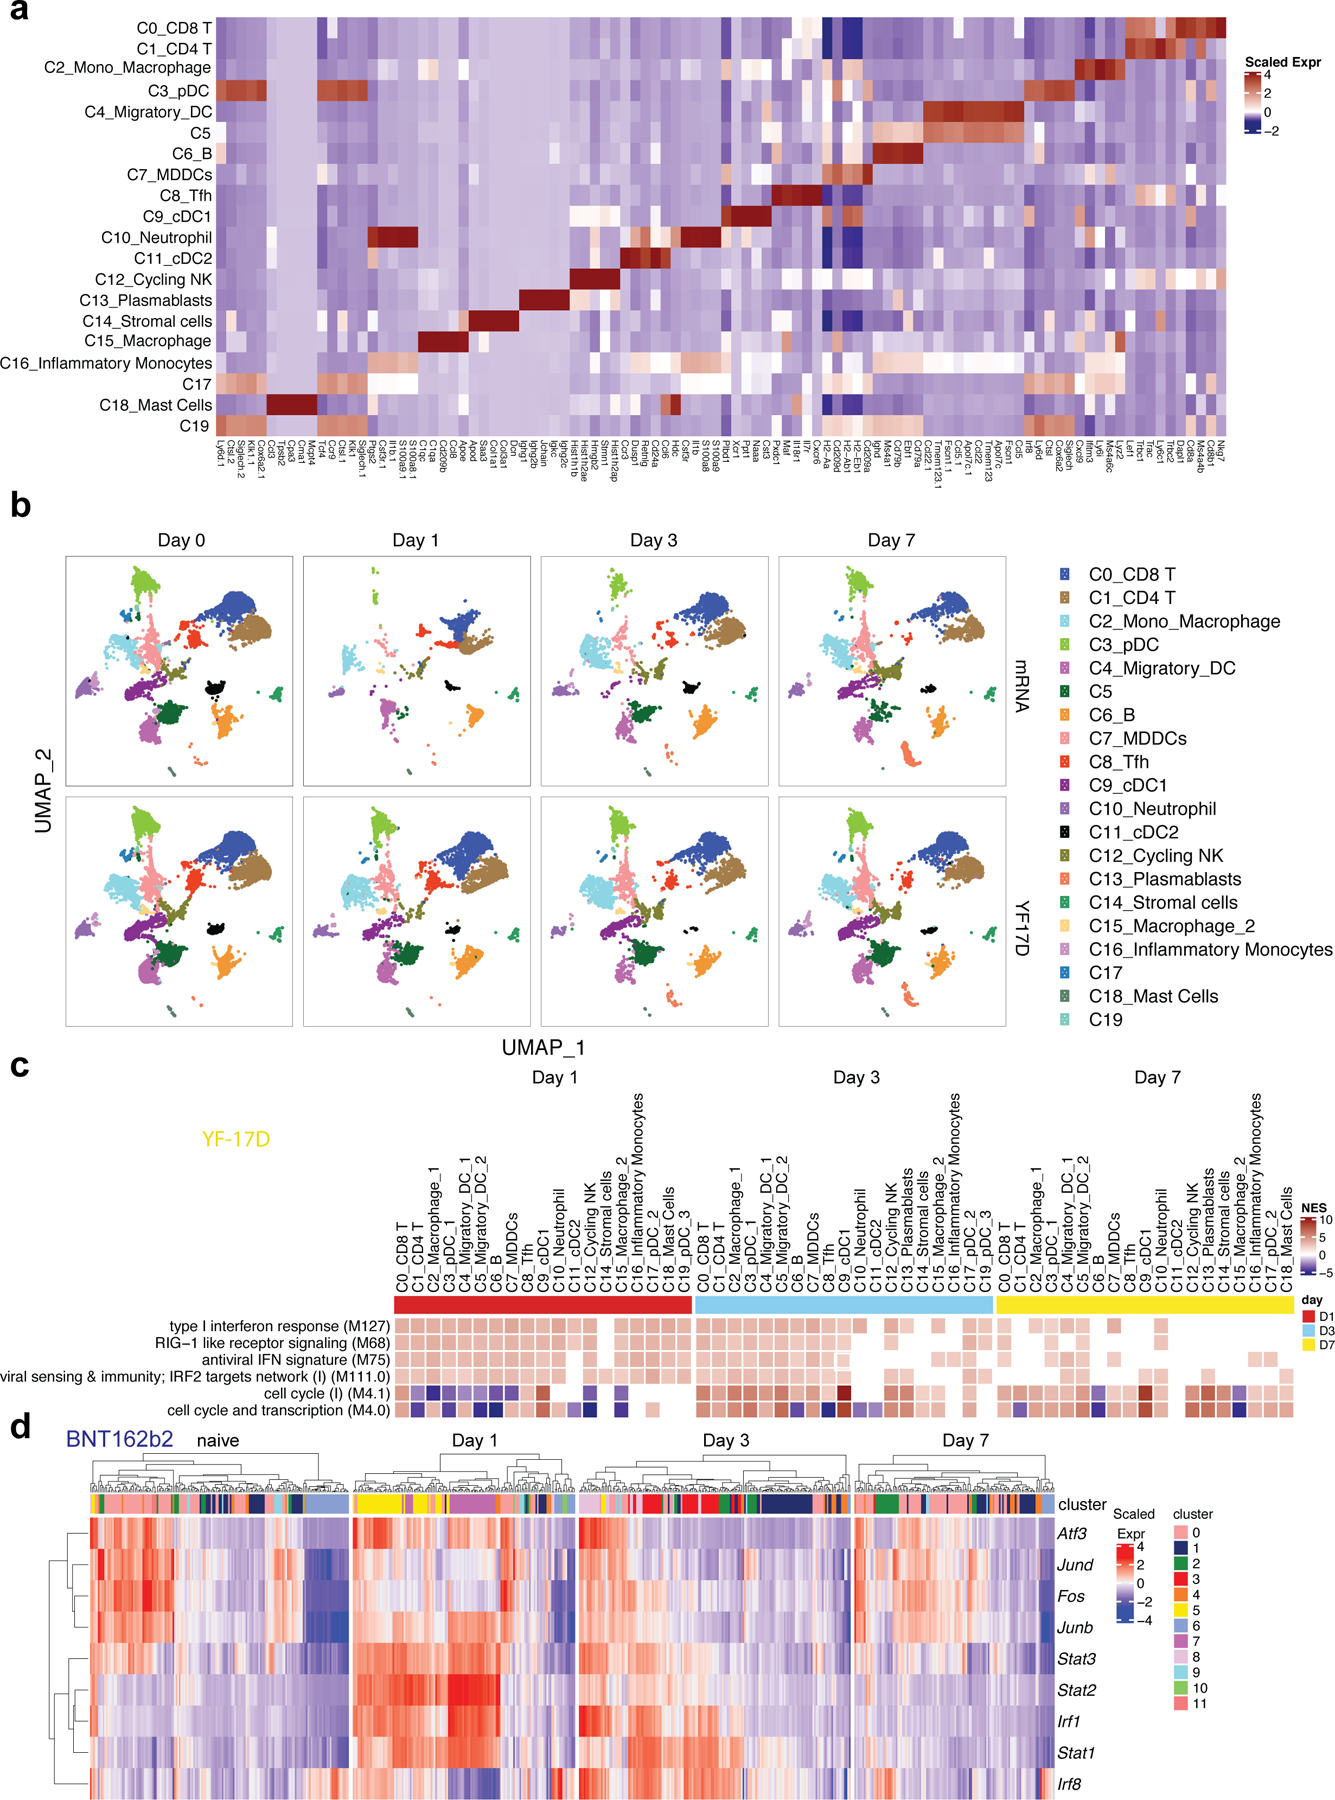
Extended Data Fig. 3. scRNAseq analysis of immune response induced by BNT162b2 and YF-17D.

a, Clusters and their associated cluster-specific genes. b, UMAP of cell types clustered by single-cell transcriptional analysis at indicated time. c, Significantly enriched interferon BTMs (false discovery rate [FDR]< 0.05, absolute normalized enrichment score [NES]> 2) across all clusters from days 1 to 7 after YF-17D immunization. Only clusters with a significantly modulated pathway are shown. d, Heatmap of key interferon response and AP-1 transcription factors after BNT162b2 immunization over time. Samples used for scRNAseq were pooled from three independent experiments containing 8–10 mice.
