
Extended Data Fig. 4. IFNγ production after prime and boost.
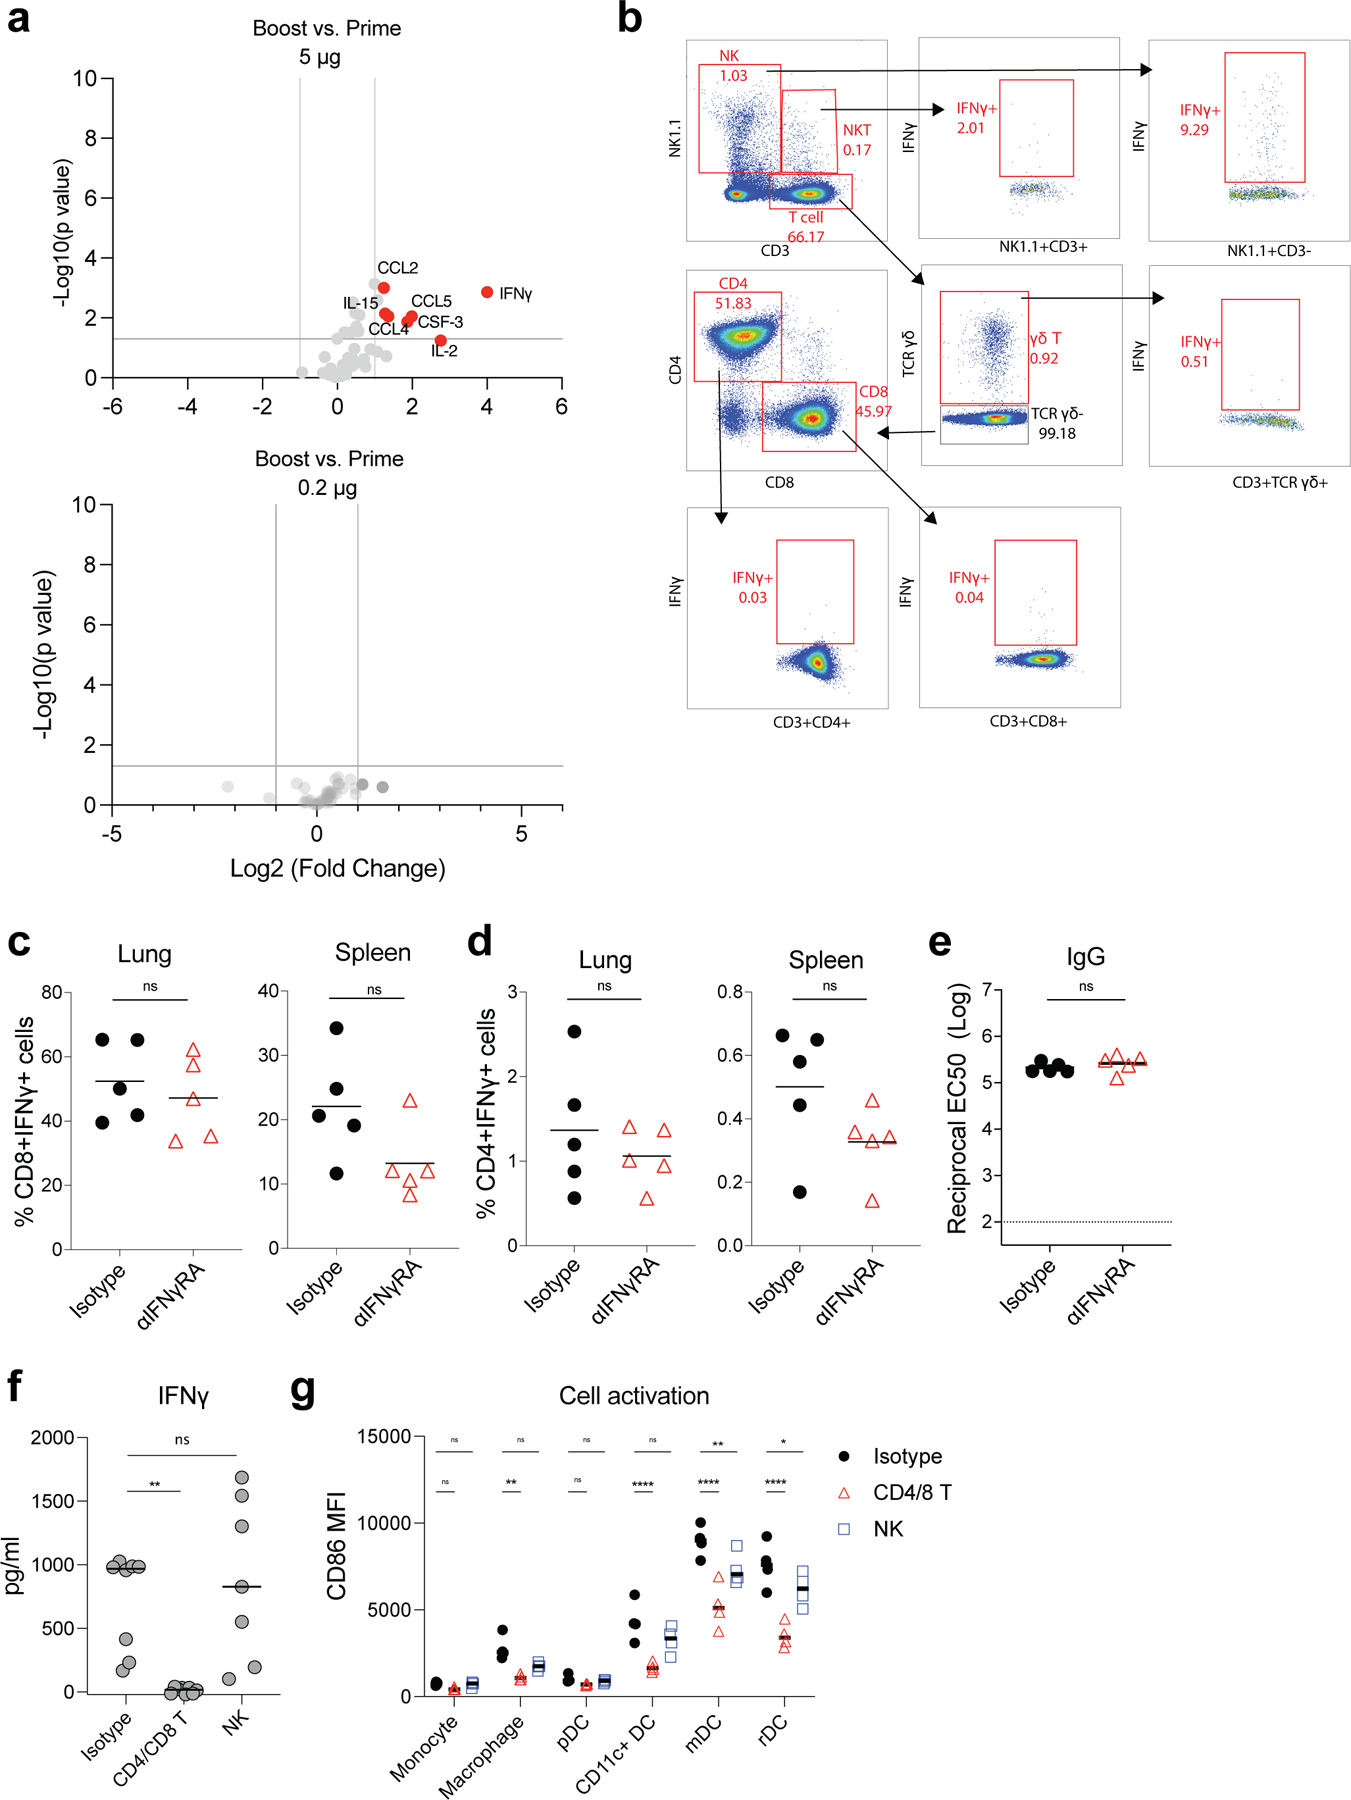
a, Luminex assay of serum cytokines/chemokines at 6 h post-prime and boost with 5 μg/mouse and 0.2 μg/mouse, respectively. Data were combined from five mice for each group. b, Gating strategy to analyze IFNγ producing cells in dLNs. c-e, CD8+ and CD4+ T cell responses, and IgG titer at day 42 after blocking of IFNγ receptor. Mice were treated with IFNγ receptor neutralizing antibody or isotype control before boost at day 21. f, Serum IFNγ level at day 22 (1 day after boost) after T cells (CD4 and CD8 T cells) or NK cells depletion at day 21. g, Innate cell activation in spleen at 1 day post boost after T or NK cell depletion. P-values were determined using Student’s t-tests (two-tailed) (a, c-e), One-Way ANOVA (f), or Two-way ANOVA (g). *P<0.05, **P<0.01, ***P<0.001, ****P<0.0001.